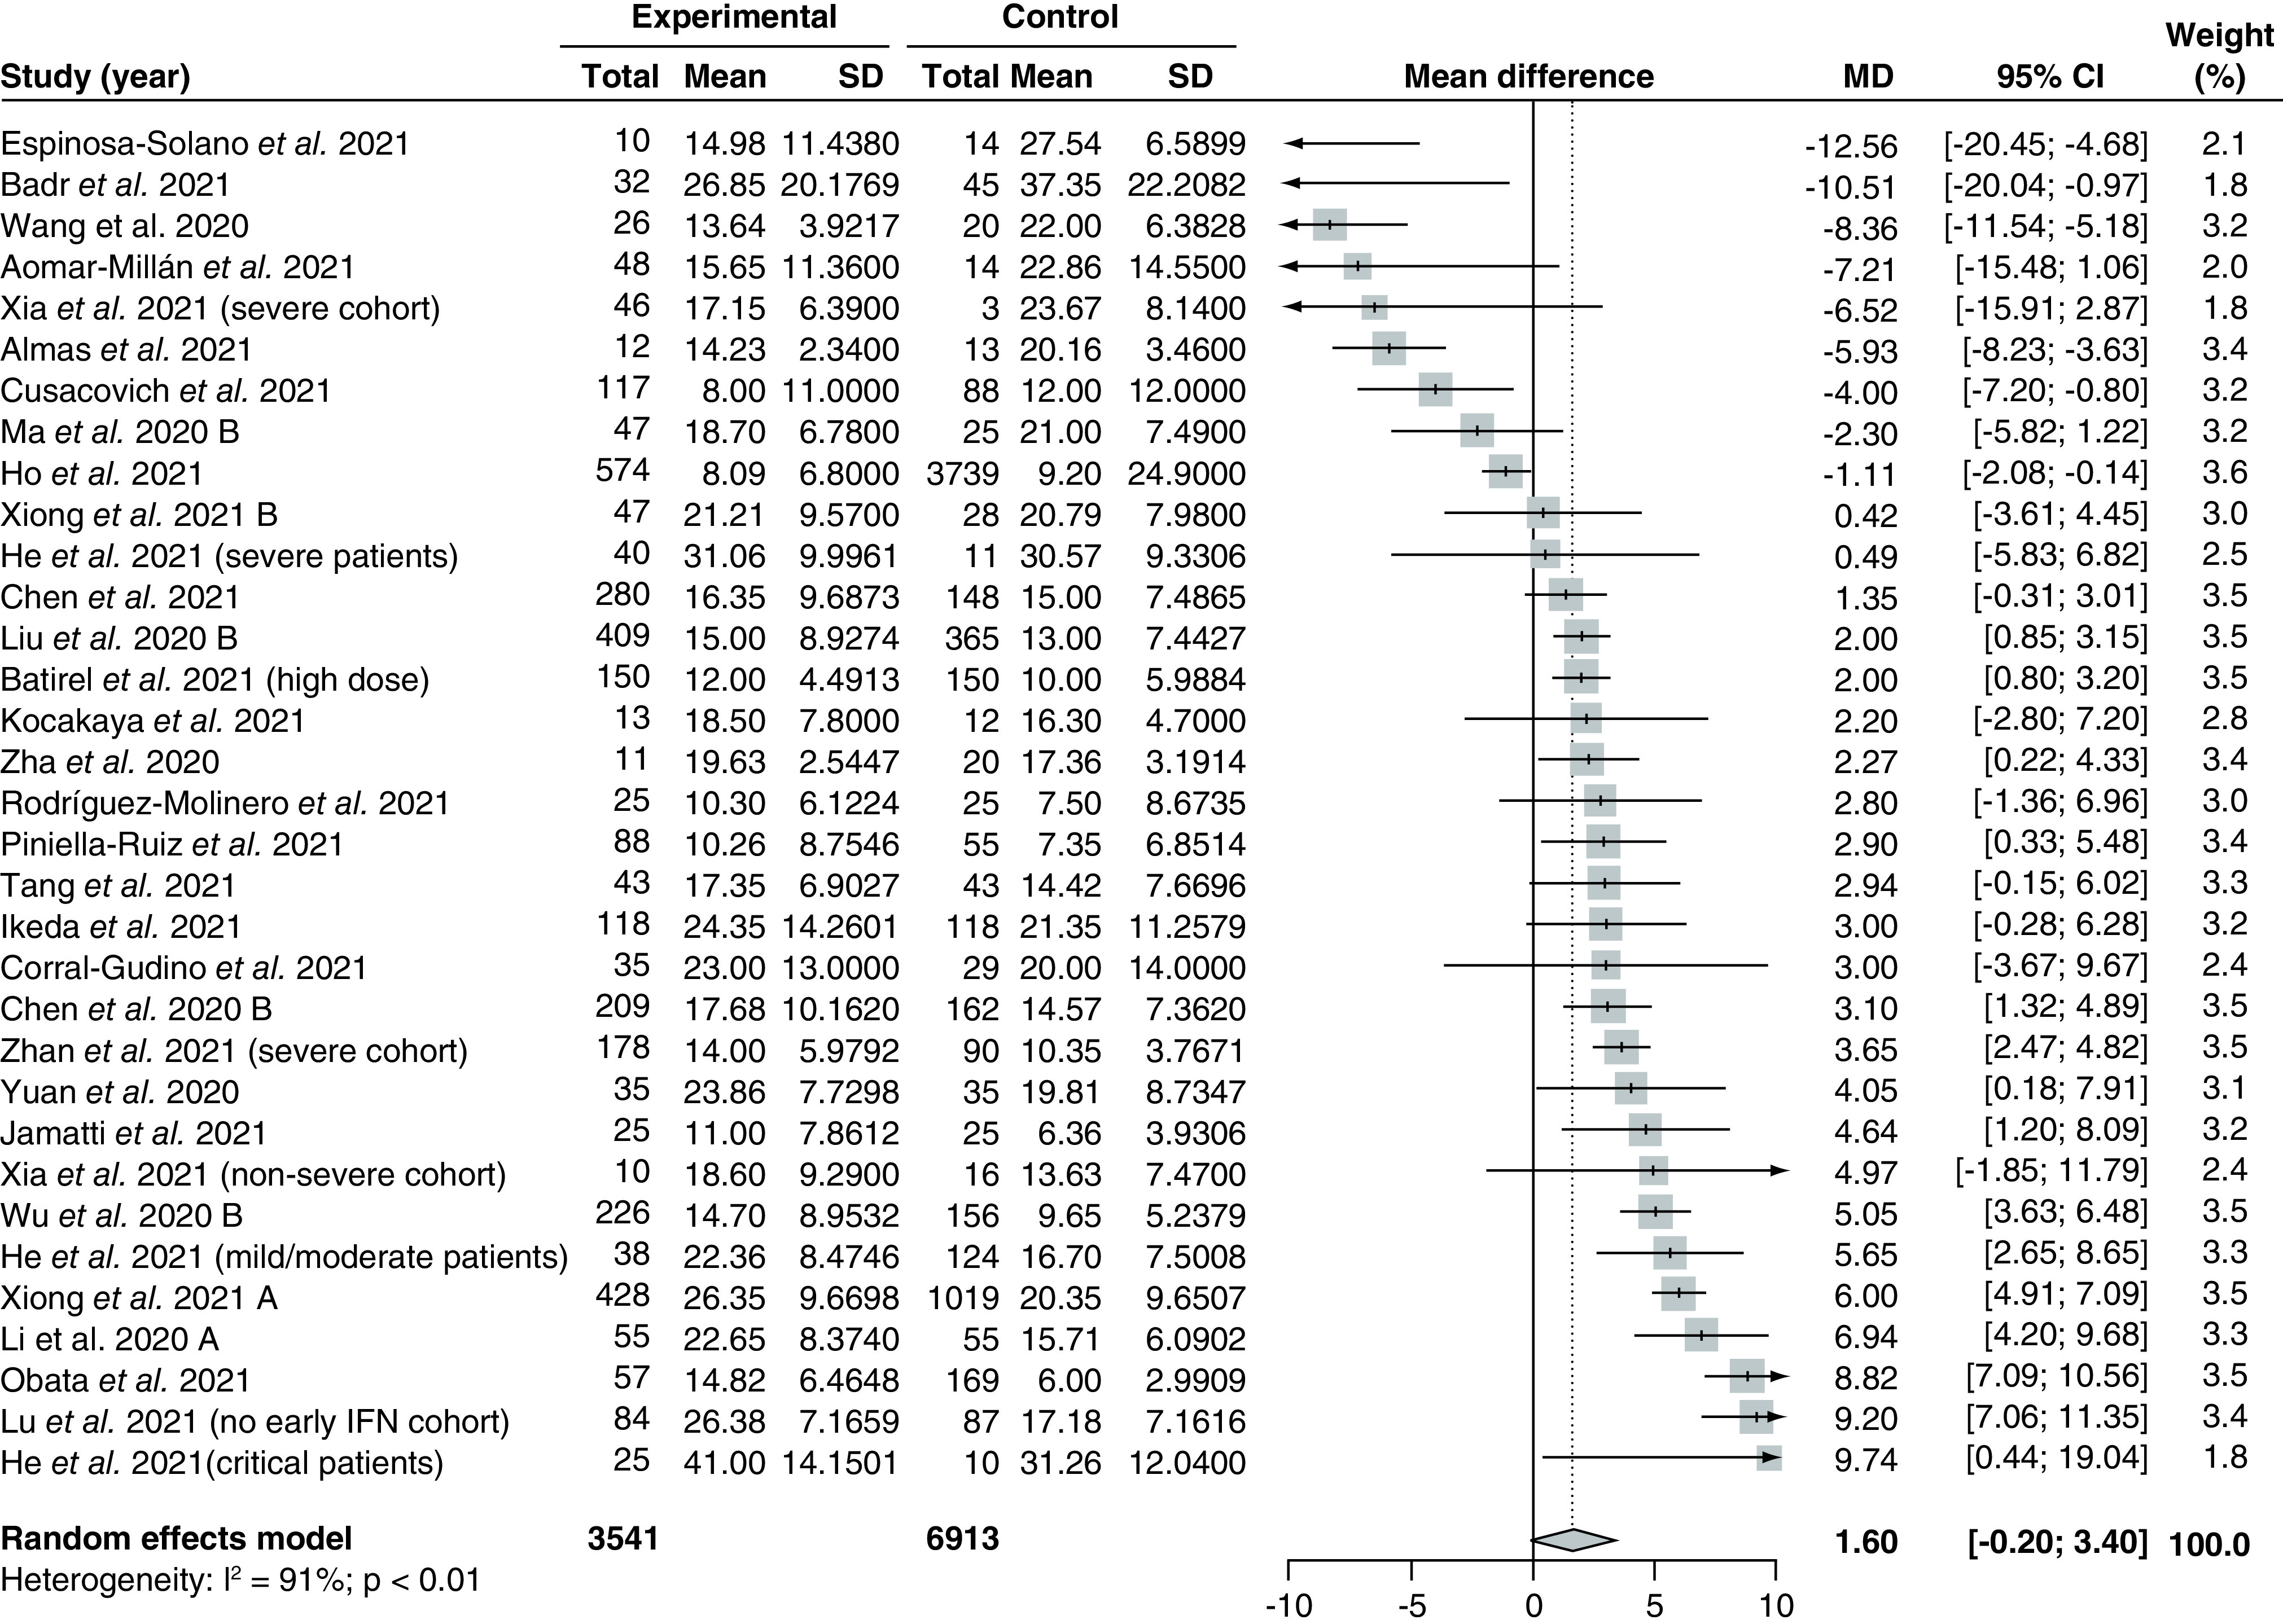
Figure 4. . Pooling of mean differences for the outcome of length of stay.

The use of corticosteroids was compared with control groups. Heterogeneity was quantified using I2 statistics. MD <0 indicates beneficial treatment effects of corticosteroids compared with control groups.
IFN: Interferon; MD: Mean difference; SD: Standard deviation.
