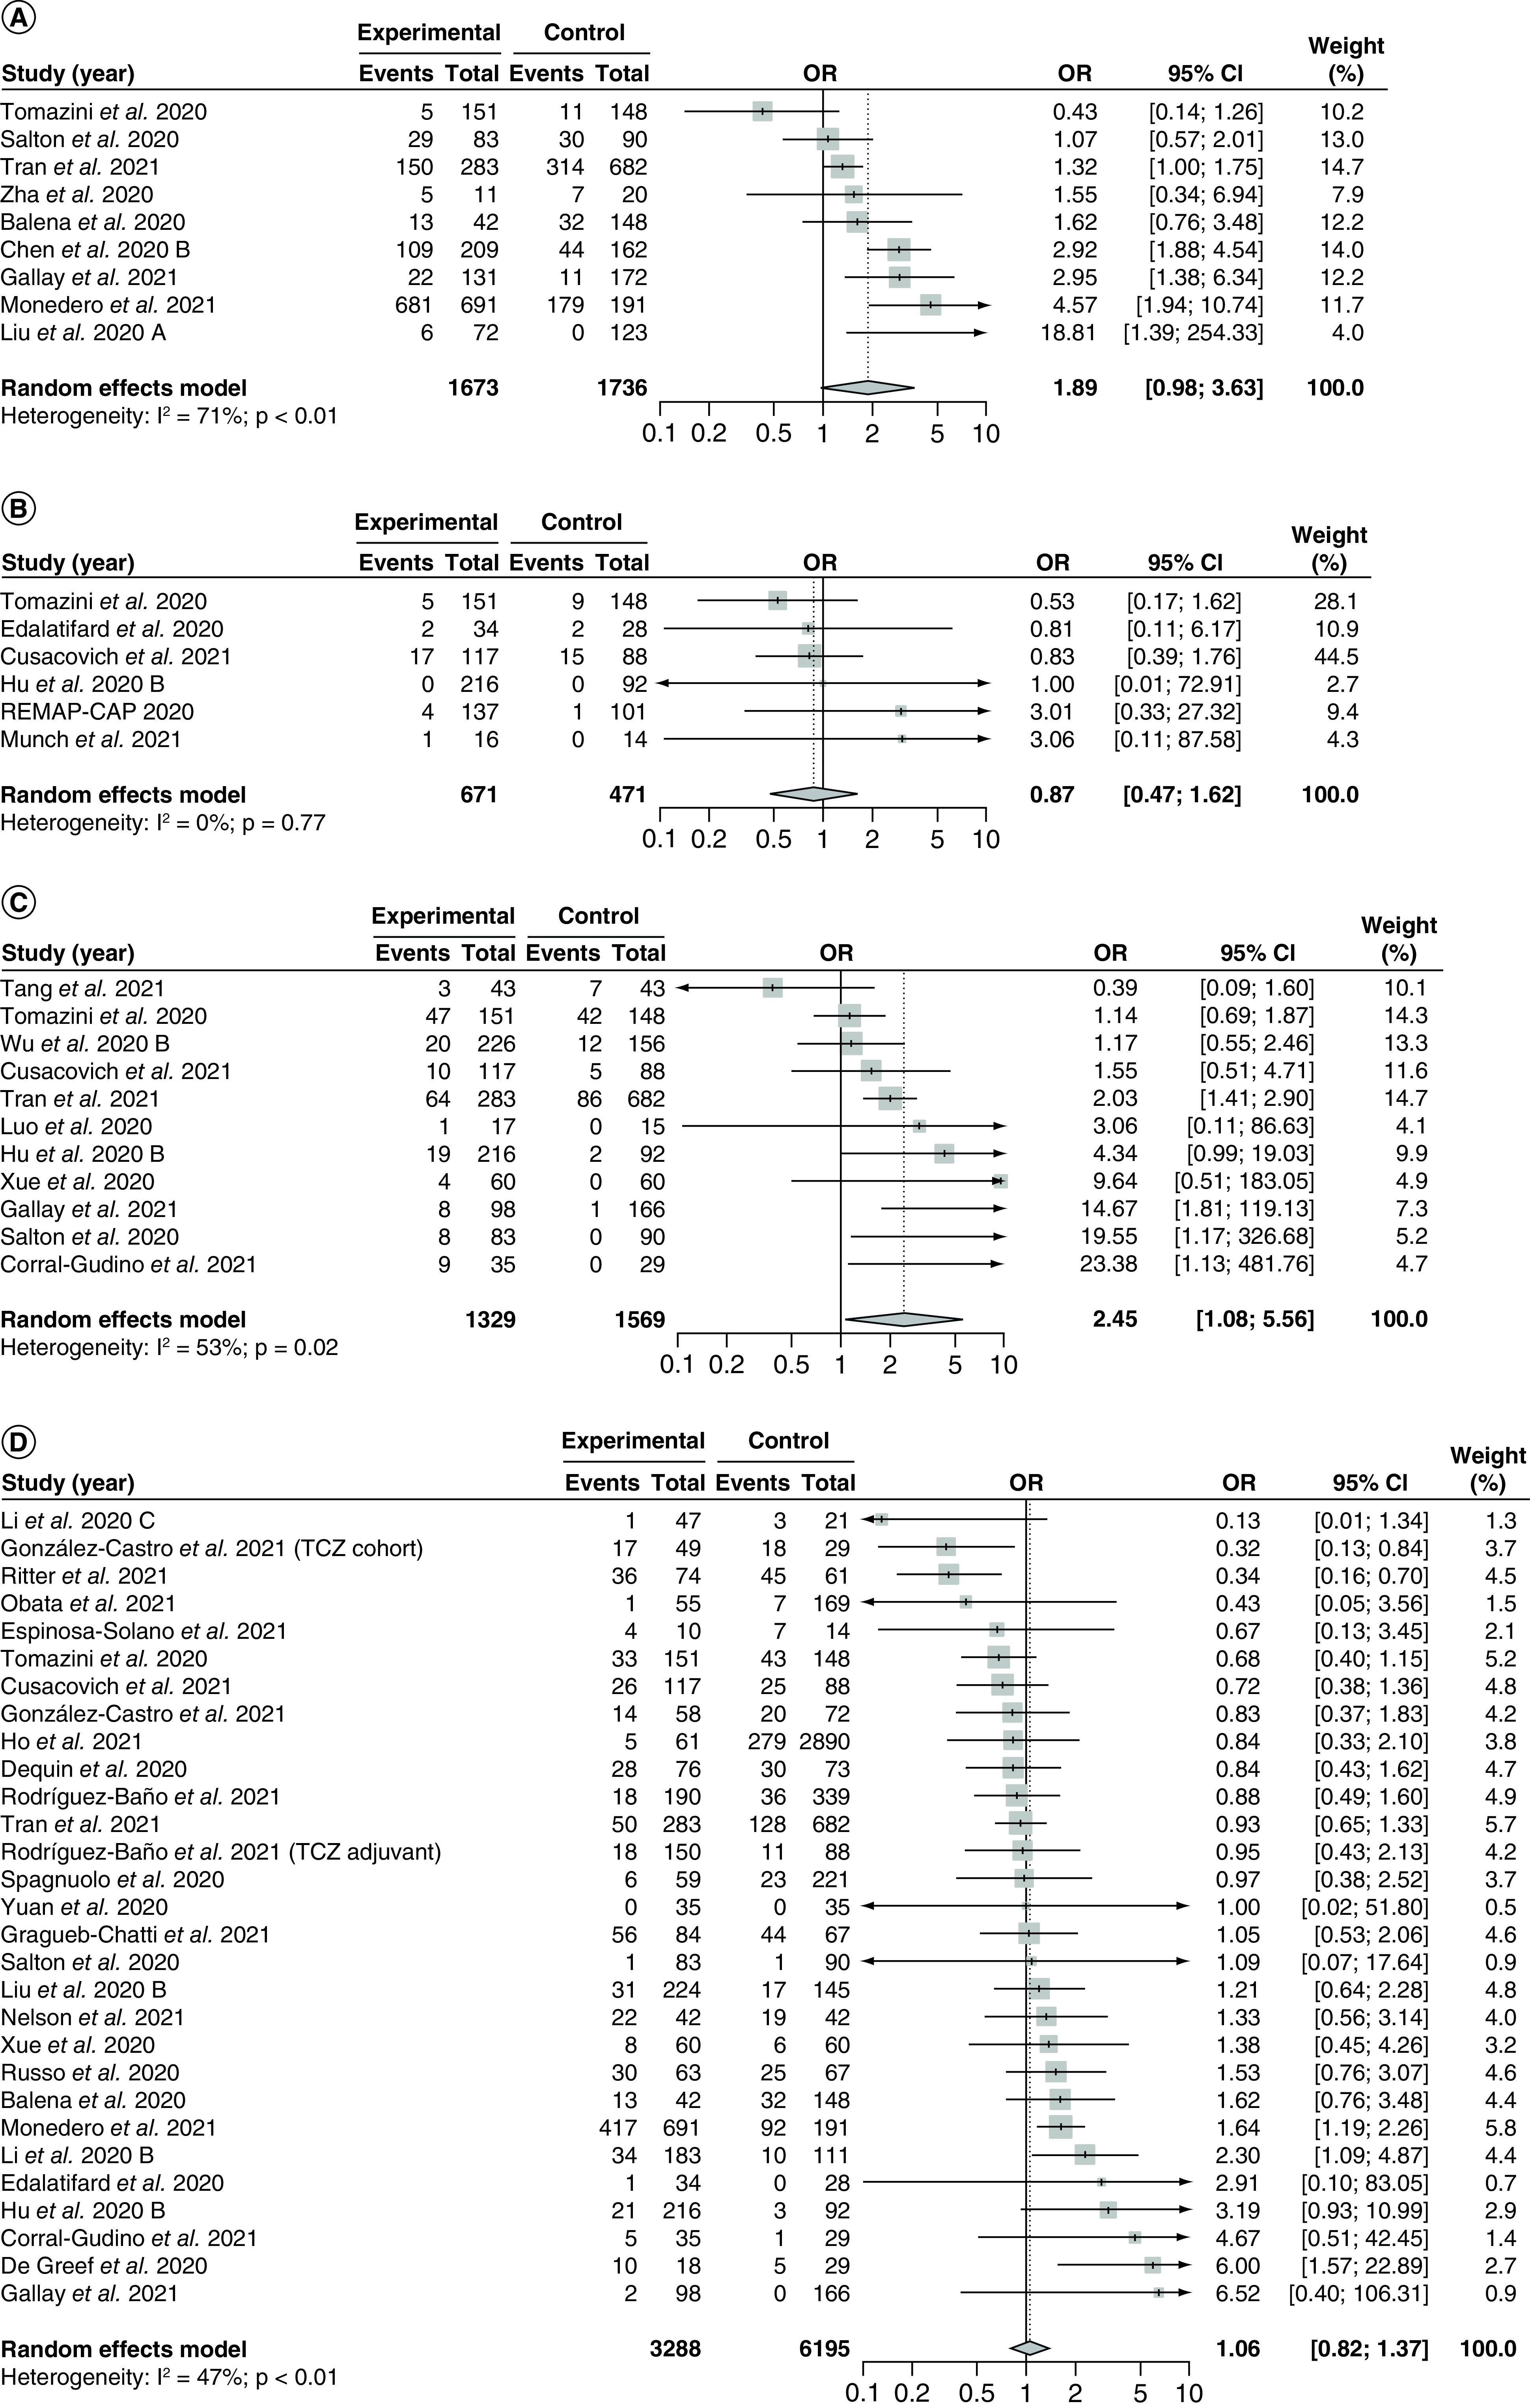
Figure 8. . Pooling of odds ratios for all safety outcomes.

The use of corticosteroids was compared with control groups. Heterogeneity was quantified using I2 statistics. (A) Forest plot for the pooling of ORs for incidence of adverse events. (B) Forest plot for the pooling of ORs for incidence of serious adverse events. (C) Forest plot for the pooling of ORs for incidence of hyperglycemia. (D) Forest plot for the pooling of ORs for incidence of nosocomial infections.
OR <1 indicates beneficial treatment effects of corticosteroids compared with control groups for all safety outcomes.
OR: Odds ratio; TCZ: Tocilizumab.
