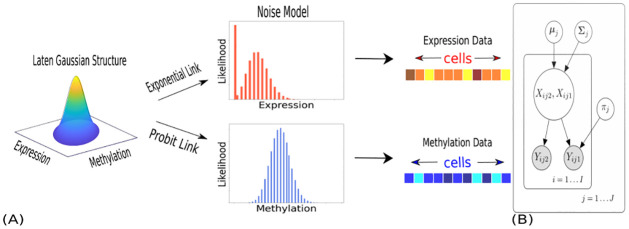
Fig 1. Schematic and graphical representations of SCRaPL.
Here, we assume observed data consists of RNA expression and DNA methylation. 1A Schematic representation of the SCRaPL model. 1B SCRaPL’s graphical model, depicting the statistical dependencies between observed genomic data (Yij1 is RNA expression; Yij2 is DNA methylation), their associated latent variables (Xij1, Xij2) and feature-specific model parameters (μj, Σj). The additional parameter πj is specific to the noise model that is assigned to RNA expression data and captures zero inflation. Full details are given in the model description section in Methods.

