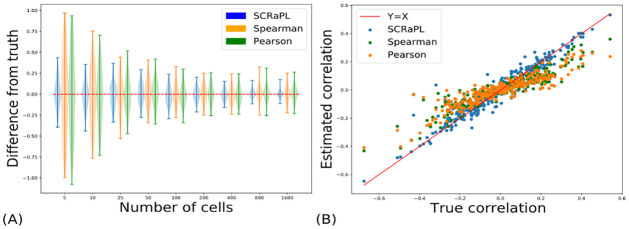
Fig 2. Plots summarizing differences in correlation estimation between SCRaPL, Spearman in Experiment 1 with synthetic data.
(2A) Estimated correlation difference from true correlation as a function of cells for SCRaPL, Spearman and Pearson. (2B) Estimated correlation as a function of true correlation for SCRaPL, Spearman and Pearson in synthetic datasets with 300 genes and 1600 cells. Each dot represents a gene and is color-coded based inference approach.

