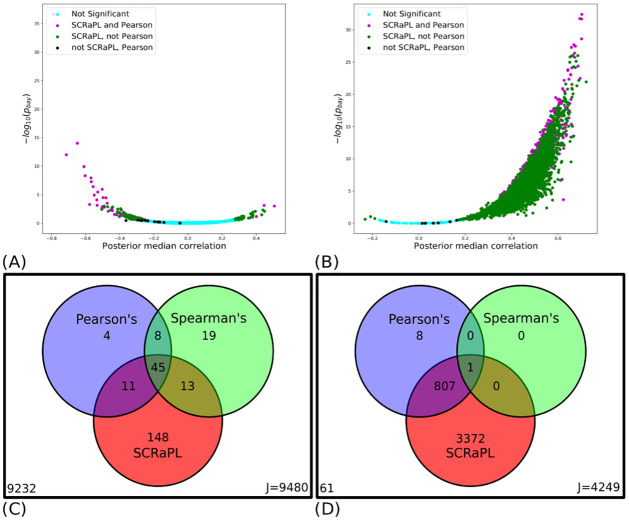
Fig 3. Summary of experiments on real data.
Figures summarizing most important points from synthetic and real data experiments. (3A, 3B) Bayesian volcano plots for mESC and mEBC data respectively. Scatter plot of posterior probability under the null hypothesis (in log scale) as a function of posterior median correlation. Each dot represents a feature and is marked with different color depending the method that labels it as a significant association. (3C, 3D) Venn diagrams summarizing detection rates for SCRaPL, Pearson and Spearman in mESC and mEBC data. By accounting for different sources of noise it detects a large set of features identified by frequentist alternatives. SCRaPL also uncovers a additional large set that would be impossible for frequentist methods to identify in a robust way.

