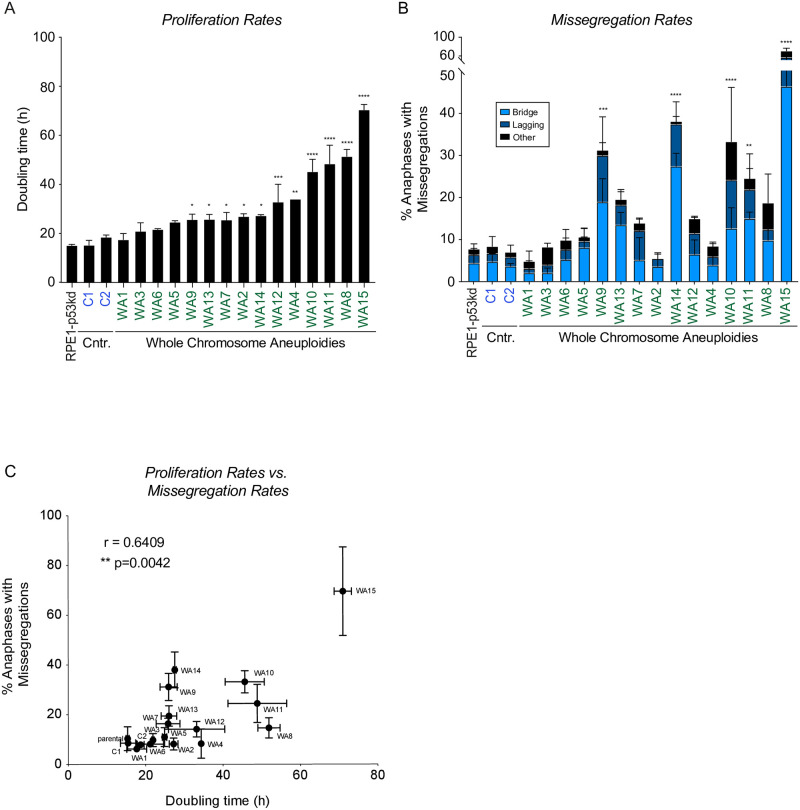
Fig 1. Aneuploid clones show a spectrum of different doubling times and mis-segregation rates.
A. Doubling time of the parental cell line (labeled in black), two euploid clones (blue) and aneuploid clones (green) determined via live cell imaging. Error bars indicate standard deviation. An ordinary one-way ANOVA was performed between clones and parental cells. P-values are assigned according to GraphPad standard. B. Chromosome missegregation rates determined by live cell imaging of parental RPE-1 p53KD cells (labeled in black), euploid (blue) and aneuploid (green) clones from S1 Fig, divided into three subcategories: lagging DNA, anaphase bridges and others (multipolar spindle, polar chromosome, cytokinesis failure, binucleated cell). All conditions were analyzed blinded. Bars are averages of at least 2 experiments and a minimum of 50 cells were filmed per clone. Error bars indicate standard deviation. An ordinary one-way ANOVA was performed between parental and clones. P-values are assigned according to GraphPad standard. C. Spearman correlation between the proliferation rate as measured in A and the missegregation rates as a percentage of anaphases as measured in B.

