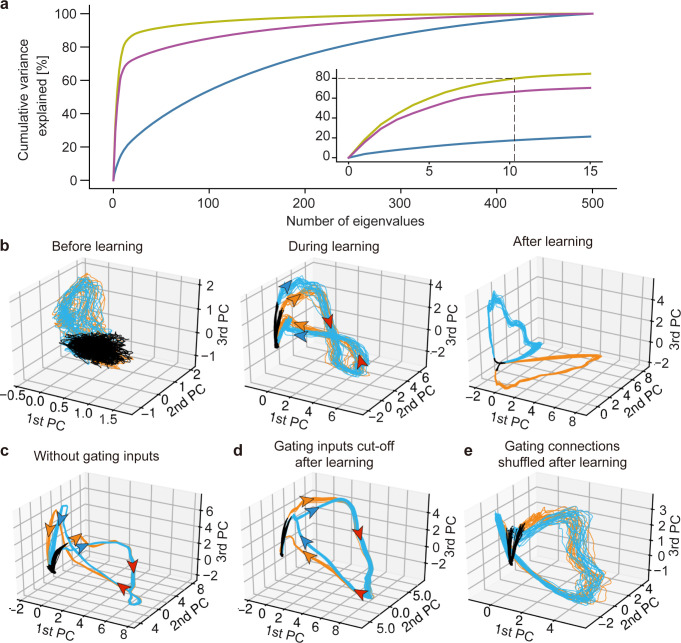
Fig 4. Principal component analysis of the trained network.
(a) Cumulative variance explained of the PCs of the activities of before (blue), during (purple), and after (yellow) learning. Inset is an expanded view for major eigenstates. (b) The PCA-projected trajectories of network activity before, during, and after training are shown in the space spanned by PC1 to PC3. The network was trained with the same task as in Fig 2. The black, orange, and blue trajectories represent the periods during which random spike input, chunk 1 and chunk 2 were presented, respectively. (c) Recurrent gating was fixed in all neurons during the whole simulation. (d) The gating factor was clamped after the network in (b) were trained. (e) Recurrent connections were randomly shuffled after the network in (b) were trained. The directions of state evolution are indicated by arrows along the PCA-projected trajectories. The arrows are colored according to the corresponding chunks on the separated parts of the trajectories while they are colored in red on unseparated parts.

