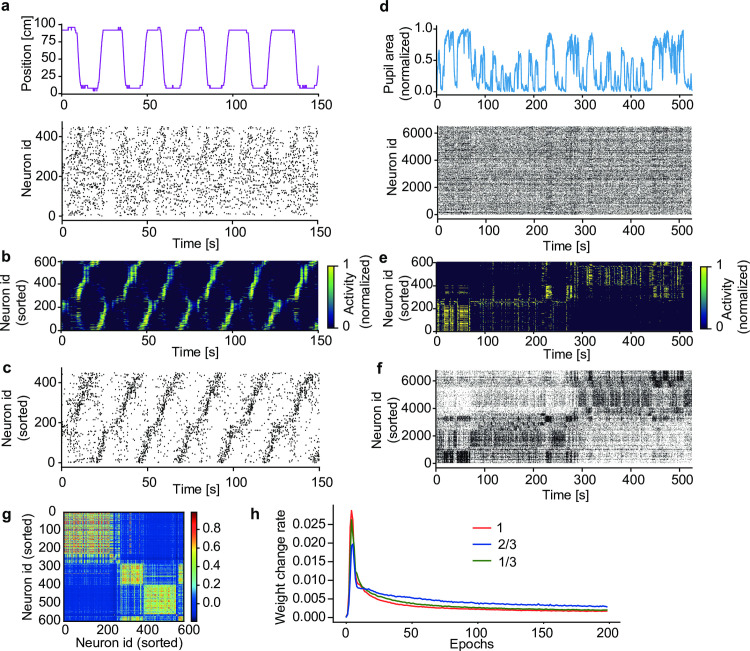
Fig 6. Detecting salient activity patterns in calcium imaging data.
(a) The positions of a mouse (top) on a linear track and calcium imaging data of activity of 452 hippocampal CA1 neurons (bottom) were obtained from previously recorded data [23]. (b) The learned activities of model neurons were sorted according to their onset response times. (c) Each CA1 neuron was associated with a model neuron having the highest mutual correlation with the CA1 neuron. Then, the CA1 neurons were sorted according to the serial order of model neurons shown in (b). (d) The time course of normalized pupil area (top) and simultaneously recorded activities of 6,532 visual cortical neurons (bottom) were calculated from previously recorded data [24,25]. (e) Activity of a trained network model was sorted according to their onset response times (Methods). (f) Activities of the cortical neurons were sorted as in (c). (g) Correlation matrix of the population of network neurons is shown. (h) Learning curves over 200 epochs for various size of input neurons are shown. Red, blue and green traces show learning curves with the number of input neurons 1, 2/3, 1/3 times smaller than original 6,532 neurons. The weight change rate was calculated as the ratio of the sum of the absolute values of synaptic changes to the sum of the absolute values of all synapses.

