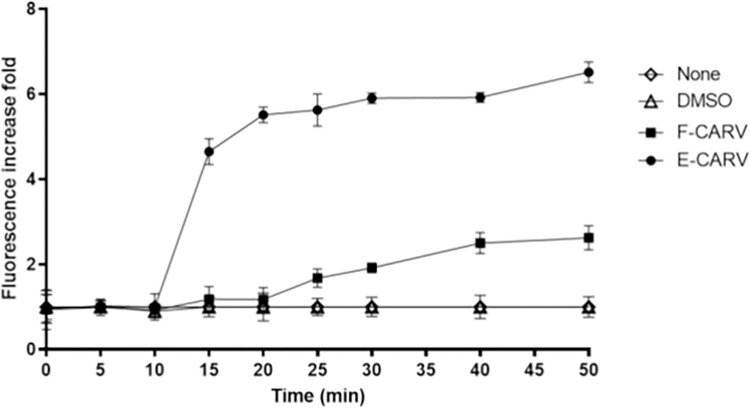
Fig 6. Assessment of cytoplasmic membrane permeability of P. aeruginosa GFP (ATCC ®10145GFP™) after treatment with F-CARV and E-CARV.
The black arrow indicates the time at which F-CARV or E-CARV were added. The fluorescence of the GFP was measured using spectroscopy at an excitation and emission wavelength of 485 to 510 nm, respectively. Data are presented as means (±SD) of three independent experiments. Control represents cell treated with HEPES buffer containing DMSO for F-CARV and without DMSO for E-CARV.

