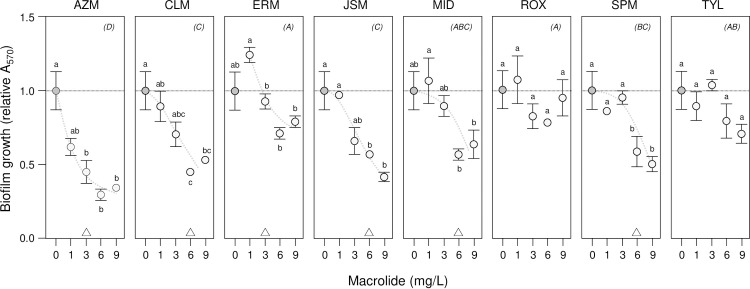
Fig 2. MTT assays of K. pneumonia biofilm growth show inhibition by macrolides.
The inhibition of K. pneumonia ATCC 10031 biofilm growth by eight macrolides was investigated by biofilm assays using the metabolic indicator dye MTT with absorbance (A570) measurements after 24 h incubation. Mean relative A570 ± SE (n = 3) is shown, with the no-macrolide (control) treatment indicated by dark circles and 1–9 mg/L macrolide treatments by light circles (trends are suggested by dashed curves). Means not connected by the same letters within panels are significantly different (LSMeans Differences Tukey HSD, alpha = 0.05 for individual macrolide mixed-effects models). Triangles at the bottom of panels indicate biofilm minimum inhibitory concentrations (MIC) where relative A570 was first significantly reduced by macrolide treatment. Macrolides not connected by the same letters indicated in parentheses in the top-right of each panel are significantly different (LSMeans Differences Tukey HSD, alpha = 0.05 for combined macrolide mixed-effects model of relative OD570; note no significant differences for ROX and TYL).

