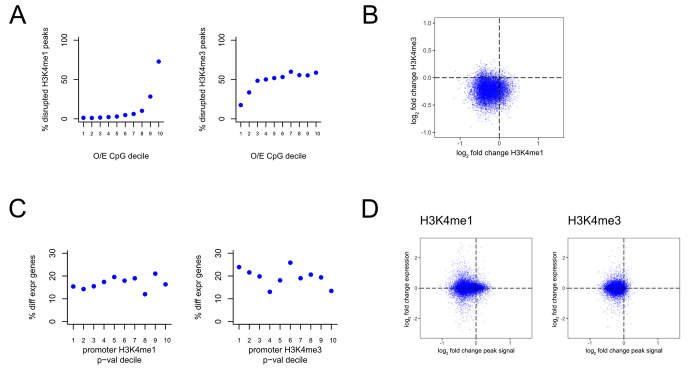
Fig 2. The relationship between disrupted H3K4me1/3, regional observed-to-expected CpG ratio, and gene expression in Kmt2a-deficient mice.
(A) The percentage of disrupted H3K4me1 peaks (left) and H3K4me3 peaks (right), stratified based on the observed-to-expected CpG ratio of the underlying peak sequence. (B) Scatterplot of the log2 fold change of H3K4me1 peaks against the log2 fold change of H3K4me3 peaks at promoters (+/-1kb from the TSS) that harbor peaks for both marks. (C) The percentage of differentially expressed genes, stratified based on the p-value of associated promoter peaks (+/- 1kb from the TSS) from the differential H3K4me1 analysis (left) and H3K4me3 (right) analysis. (D) Scatterplot of the log2 fold change of H3K4me1 peaks (left) and H3K4me3 (right) against the log2 fold change of gene expression of the downstream gene. Each point corresponds to a gene-promoter pair. In cases where multiple peaks were present at the same promoter, the average log2 fold change was computed.

