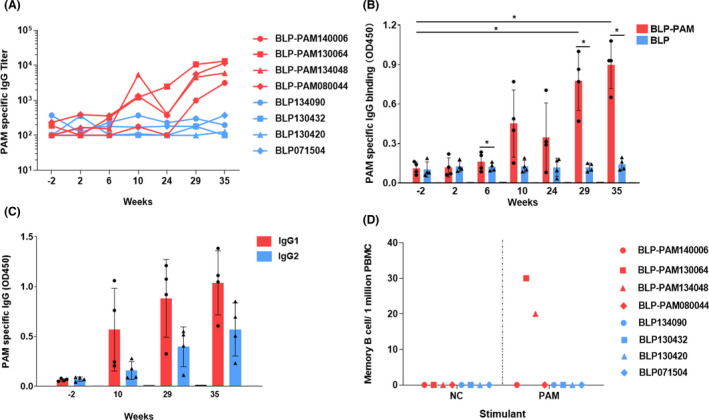
Fig. 4.

Analysis of B cell responses induced by BLP‐PAM in blood.
A. Serum IgG antibodies titres obtained from individual macaques at the indicated time points.
B. Serum IgG antibodies level obtained from macaques in group at the indicated time points.
C. BLP‐PAM serum IgG isotype analysis at the indicated time points.
D. PAM‐specific IgG memory B cells among PBMCs measured using B cell ELISPOT assay at week 39. Mean and standard deviation are indicated with lines and error bars, *P < 0.05.
