
FIGURE 1.
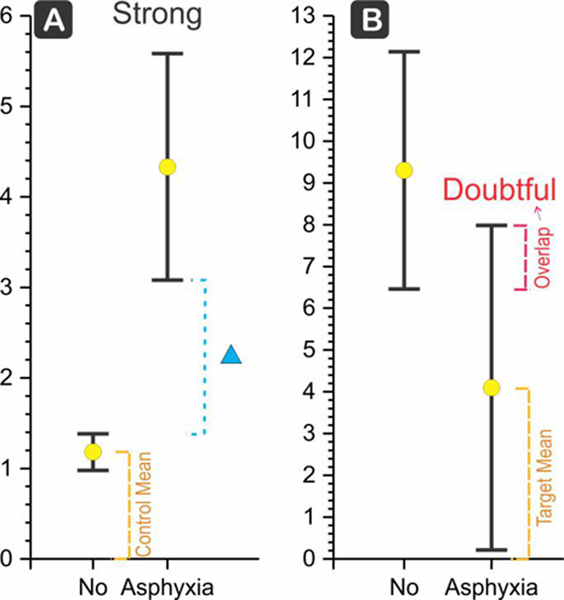
Example of a strong and a doubtful biomarker. (a) The control group (No asphyxia) was compared to a target group (Asphyxia). Data from XO (Batra et al., 1998). Mean () and lower and upper confidence intervals are shown (LCI, UCI). The difference (Δ) between the target LCI and control UCI is calculated and then divided by the control mean and expressed as a percentage(Δ% ). (b) If the CIs overlapped as shown in the dashed line, then the biomarker was considered as doubtful, as meant for a clinician. Data from NGF (Korhonen et al., 1998). Also, note if the biomarker showed a decrease in the target group, the Δ between the control LCI and target UCI was taken. This Δ was expressed as percentage of the target mean (Δ% )