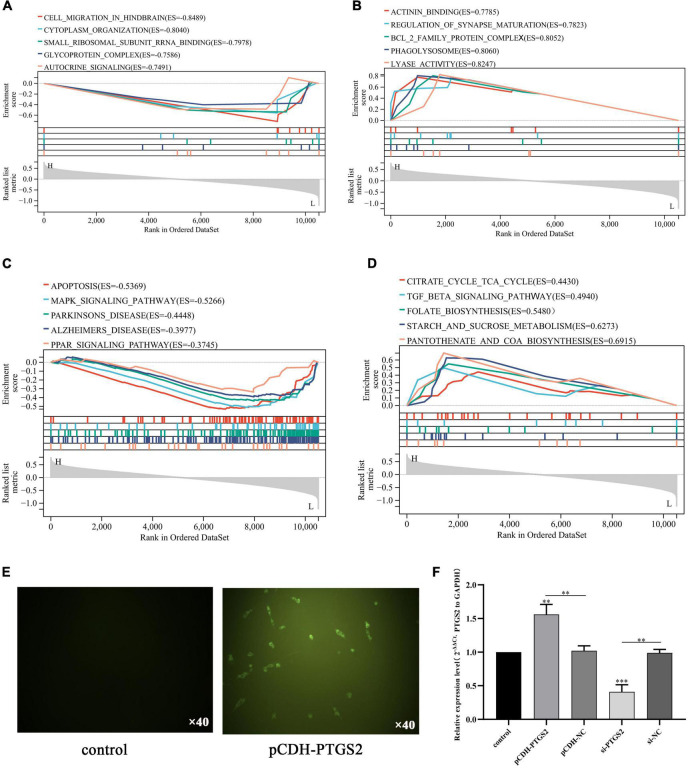
FIGURE 6.
Gene set enrichment analysis revealed five positively correlated GO term with lower expression PTGS2 (A), five negatively correlated GO term with lower expression PTGS2 (B), five positively correlated KEGG pathway with lower expression PTGS2 (C), and five negatively correlated KEGG pathway with lower expression PTGS2 (D). (E) The transfection efficiency of pCDH-PTGS2 was detected by fluorescence microscope. Scales: 10 × 40. (F) The transfection efficiency of pCDH-PTGS2 and si-PTGS2 was detected by qPCR. The expression level of GAPDH was used as an internal reference for PTGS2. The data are shown as the mean ± standard deviation. The horizontal line indicates the comparison between groups at both ends, and the non-horizontal line indicates the comparison with the control group. ***p < 0.001; **p < 0.01.

