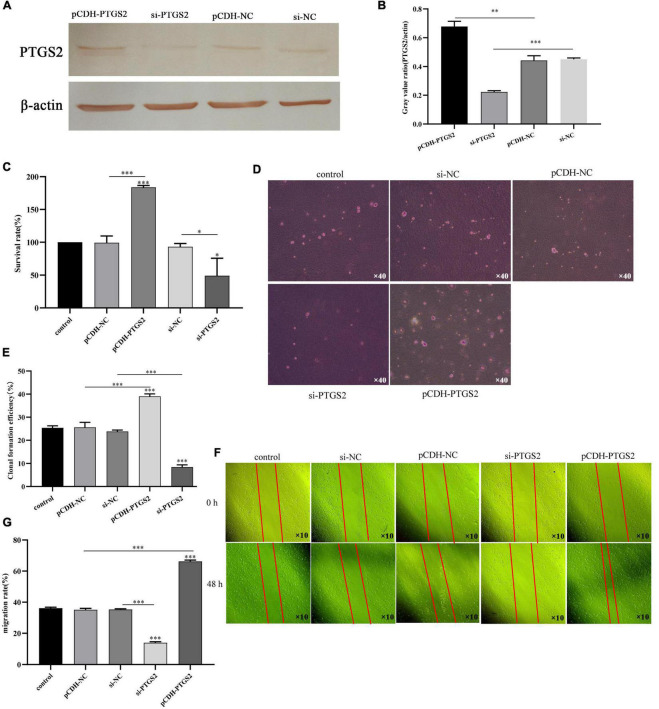
FIGURE 7.
(A,B) The transfection efficiency of pCDH-PTGS2 and si-PTGS2 was detected by western blot. (C) The effects of PTGS2 knockdown or overexpression on the vitality of AD model cells (Aβ25–35-treated SH-SY5Y cells) measured using the CCK-8 assay. (D,E) The effects of PTGS2 knockdown or overexpression on the proliferation of AD model cells (Aβ25–35-treated SH-SY5Y cells) measured using the soft agar assay. Scales: 10 × 40. (F,G) The effects of PTGS2 knockdown or overexpression on the migration of AD model cells (Aβ25–35-treated SH-SY5Y cells) measured using the wound healing assay. Scales: 10 × 10. The data are shown as the mean ± standard deviation. The horizontal line indicates the comparison between groups at both ends, and the non-horizontal line indicates the comparison with the control group. AD: Alzheimer’s disease. ***p < 0.001; **p < 0.01; *p < 0.01.

