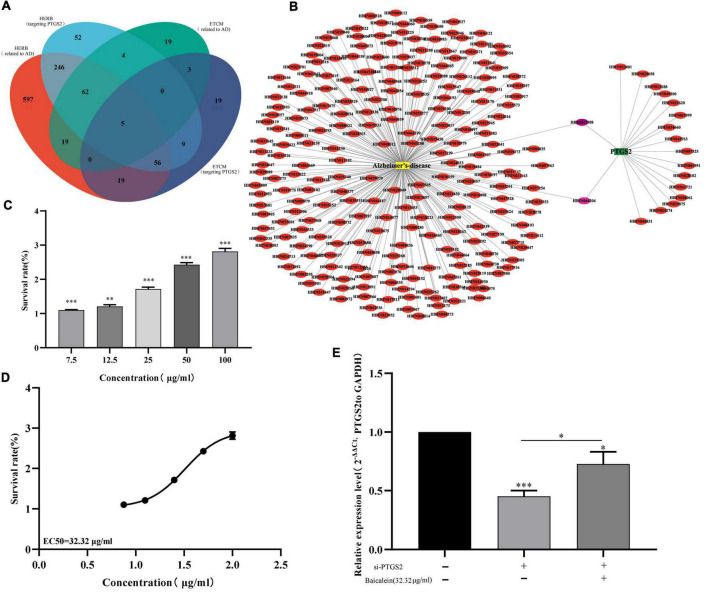
FIGURE 9.
(A) Venn diagram shows the overlap between AD related Chinese herbs and PTGS related Chinese herbs. (B) Network of AD related components in HUANGQIN and PTGS2 targeted components in HUANGQIN. (C) The effects of different concentrations baicalein on the vitality of AD model cells (Aβ25–35-treated SH-SY5Y cells) measured using the CCK-8 assay. (D) EC50 fitting curve of baicalein in AD model cells (Aβ25–35-treated SH-SY5Y cells). (E) The effect of baicalein on the expression of PTGS2 by qPCR in AD model cells (Aβ25–35-treated SH-SY5Y cells). AD, Alzheimer’s disease. The expression level of GAPDH was used as an internal reference for PTGS2. The data are shown as the mean ± standard deviation. The horizontal line indicates the comparison between groups at both ends, and the non-horizontal line indicates the comparison with the control group. ***p < 0.001; *p < 0.05.

