Figure 1.

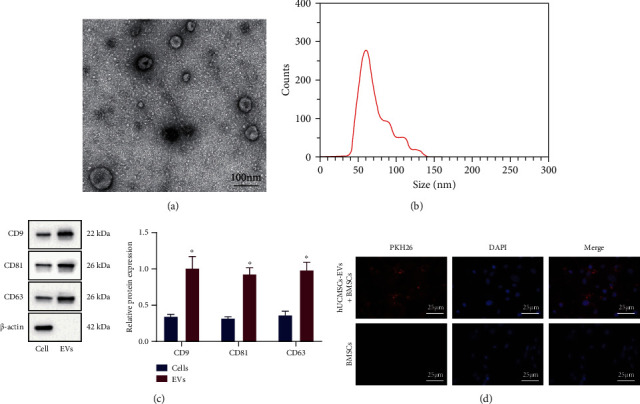
Isolation and identification of hUCMSC-EVs and observation of uptake of EVs by BMSCs. (a) EV morphology observed under the TEM (scale bar = 100 μm). (b) EV particle size distribution detected by NTA. (c) The expression of CD9, CD81, CD63, and β-actin in hUCMSCs and hUCMSC-EVs measured by Western blot analysis. (d) After PKH26 labeling of hUCMSC-EVs, uptake of EVs by BMSCs was observed under fluorescence microscopy (scale bar = 25 μm). ∗p < 0.05, compared with hUCMSCs.
