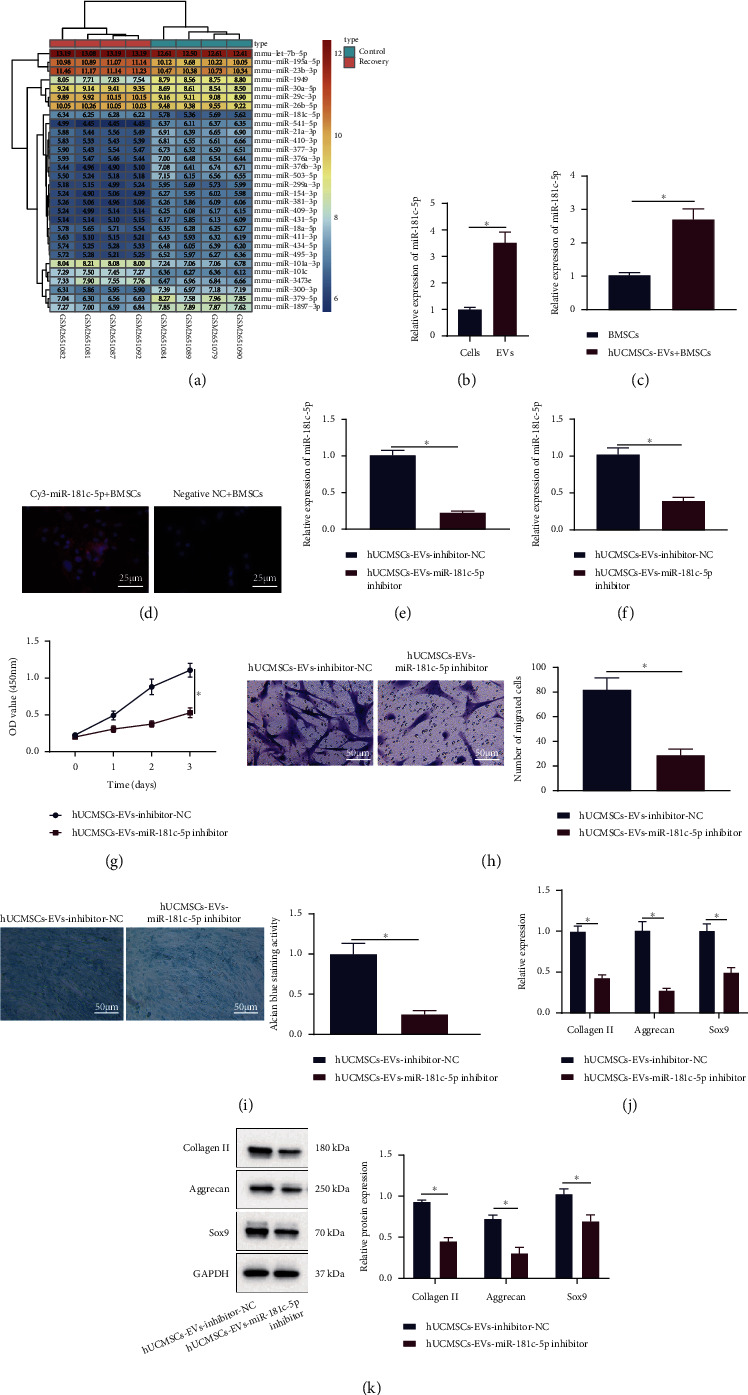
Figure 3.

Effect of hUCMSC-EVs carrying miR-181c-5p on the proliferation, migration, and cartilage differentiation of BMSCs. (a) Heat map of expression of the top 30 miRNAs with the smallest p values in GSE99736. Color scale (blue to orange) indicates expression values from small to large (n = 3). (b) miR-181c-5p expression in hUCMSCs and their secreted EVs was determined by RT-qPCR. (c) miR-181c-5p expression in BMSCs after coincubation of hUCMSC-EVs was determined by RT-qPCR. (d) The fluorescence after treatment of Cy3-labeled hUCMSC-EV-miR-181c-5p (scale bar = 25 μm). (e) RT-qPCR for miR-181c-5p expression in hUCMSC-EVs. BMSCs were coincubated with hUCMSC-EVs transduced with the miR-181c-5p inhibitor. (f) miR-181c-5p expression in BMSCs was determined by RT-qPCR. (g) Proliferation of BMSCs was detected by the CCK8 assay. (h) Migration of BMSCs was detected by the Transwell assay (scale bar = 50 μm). (i) Cartilage differentiation ability of BMSCs was detected by Alcian blue staining (scale bar = 50 μm). (j) mRNA levels of collagen II, aggrecan, and Sox9 in BMSCs were determined by RT-qPCR. (k) Protein levels of collagen II, aggrecan, and Sox9 in BMSCs were measured by Western blot analysis. ∗p < 0.05. All experiments were repeated for three times.
