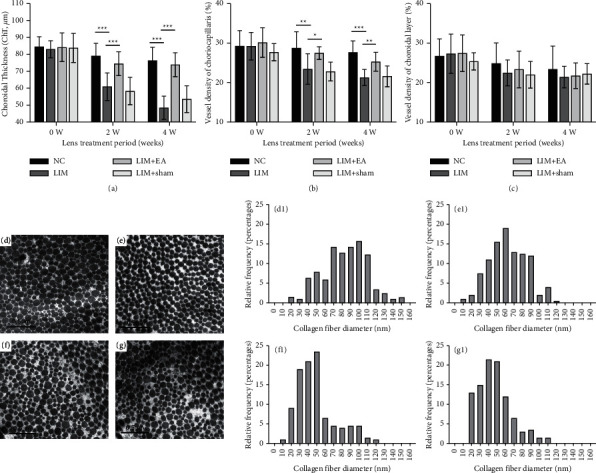
Figure 2.

Comparison of ChT, vessel density of CC, and vessel density of choroidal layer changes in the NC, LIM, LIM + EA, and LIM + sham group and collagen fibril diameter taken from representative electron micrographs (x25000) of the right eyes in four groups. (a) Comparison of ChT in four groups. (b) Comparison of vessel density of CC in four groups. (c) Comparison of vessel density of choroidal layer in four groups. (d) The scleral collagen fibril in NC group. (e) The scleral collagen fibril in LIM + EA group. (f) The scleral collagen fibril in LIM group. (g) The scleral collagen fibril in LIM + sham group. (d1) The corresponding distribution of the diameter of collagen fibrils in NC group. (e1) The corresponding distribution of the diameter of collagen fibrils in LIM + EA group. (f1) The corresponding distribution of the diameter of collagen fibrils in LIM group. (g1) The corresponding distribution of the diameter of collagen fibrils in LIM + sham group. ∗P < 0.05, ∗∗P < 0.01, ∗∗∗P < 0.001.
