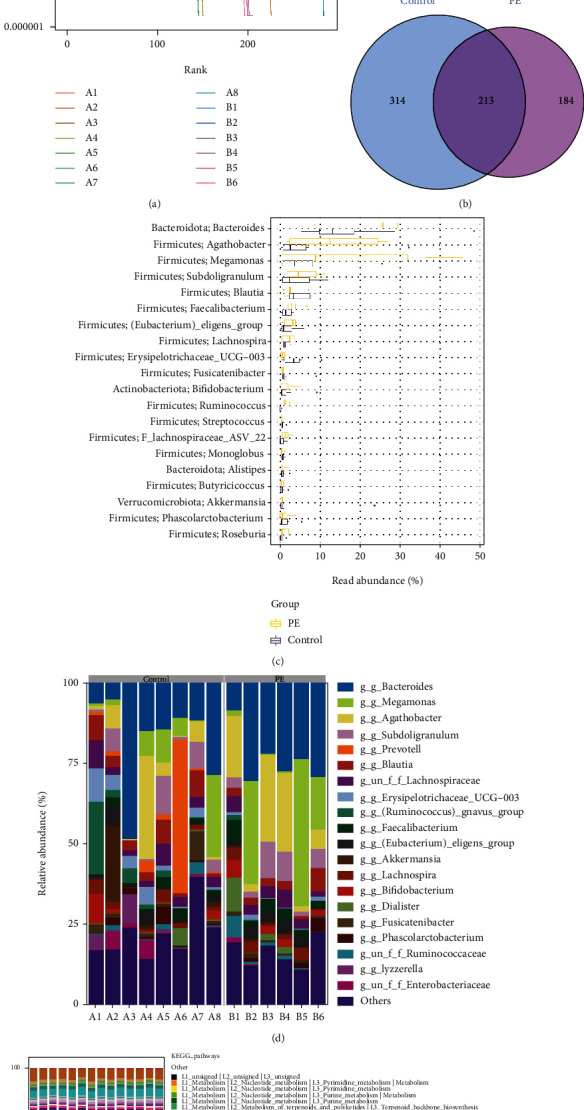
Figure 1.

Gut microbiota in PE patients were changed, and key pathway targets (LPS) were screened. (a) Rank abundance curve. (b) Venn diagram. (c) Relative abundance histogram of top 20 ASVs at the genus level. (d) Top 20 dominant gut microbiota with relative abundance at the phylum level. (e) PICRUSt analysis in the KEGG pathway. A: control group; B: PE group.
