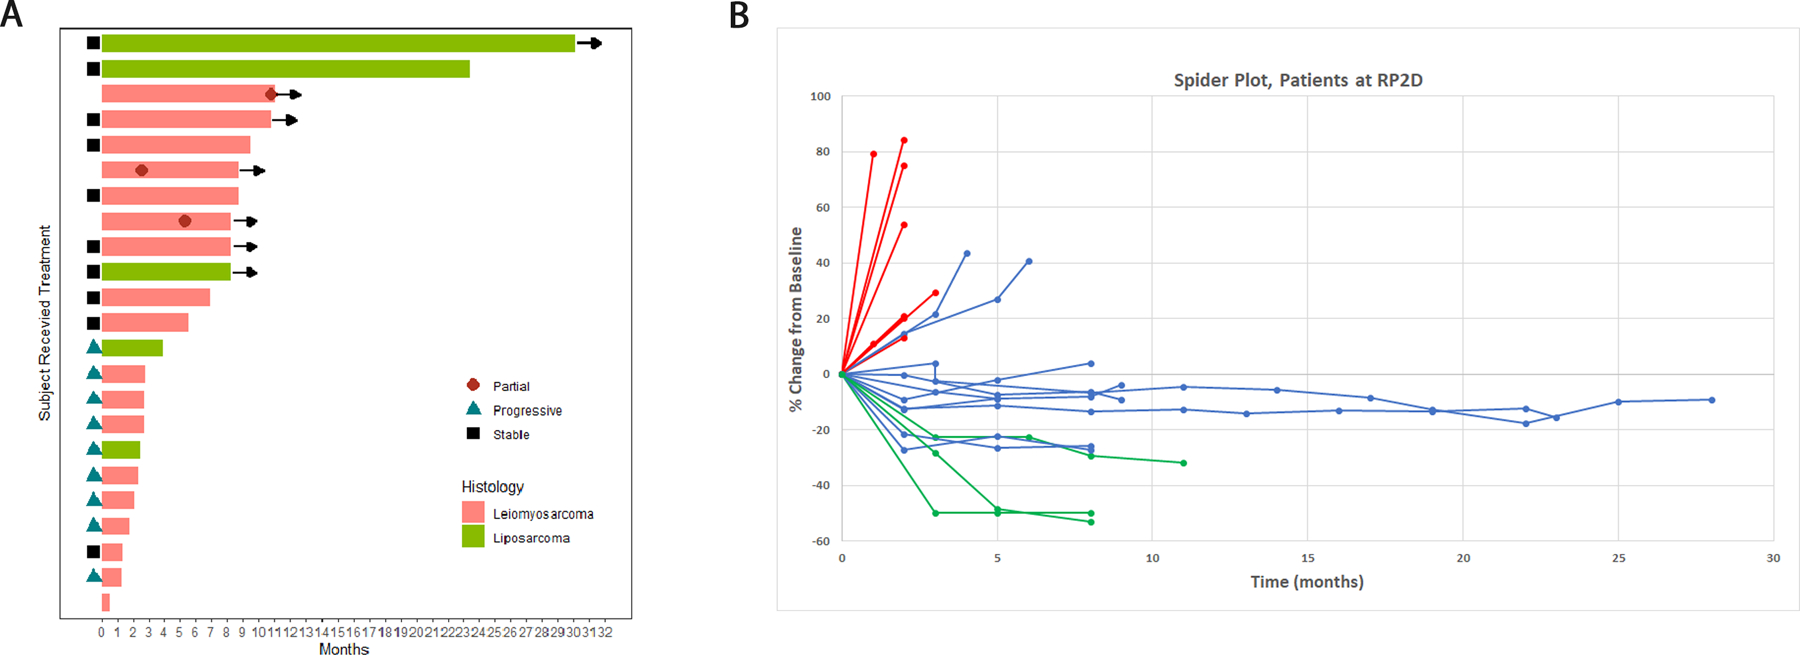
Figure 1. Swimmers plot (A) and Spider Plot (B) of patients at the RP2D.

In the swimmer plot, patients with leiomyosarcoma are indicated in pink, and those with liposarcoma are indicated in green. Time to partial response is indicated where marked on the individual patient. Patients still on treatment at the time of data cutoff are indicated by an arrow. In the spider plot (B) patients with progressive disease as best response are marked in red, those with stable disease as best response are blue, and those with partial response are green.
