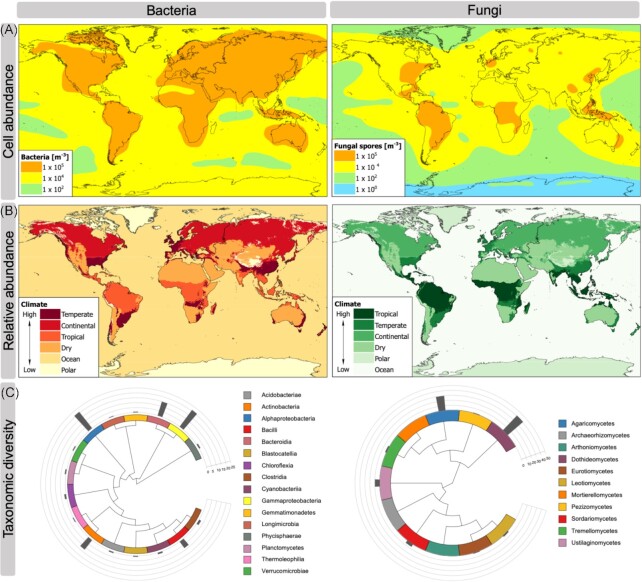
Figure 3.
Patterns of microbial diversity and abundance in the atmosphere. (A) Simulated concentration of bacterial cells and fungal spores in the near surface atmospheric boundary layer, adapted from Hoose, Kristjánsson and Burrows (2010). Models assumed a uniform bacterial cell diameter of 1 µm and fungal spore diameter of 5 µm (Burrows et al. 2009), and emission rates were estimated from observed and modelled data (Burrows et al. 2009, Heald and Spracklen 2009). (B) Predicted global relative abundance of bacteria and fungi in the near-surface atmospheric boundary layer from observed quantitative PCR of rRNA genes in air above locations within different climatically defined biomes (Archer et al. 2022). The use of quantitative PCR data is cautiously interpreted here as relative abundance and is not used to infer cell numbers. These data are also domain specific and cannot be directly compared between bacteria and fungi. (C)Taxonomic composition by class of bacteria and fungi in the near-surface atmospheric boundary layer inferred from rigorously decontaminated environmental rRNA gene sequence data from globally distributed locations, adapted from Archer et al. (2022). Coloured boxes indicate classes encountered at a relative abundance of ≥0.1%. Grey bars indicate percentage relative abundance for each class.

