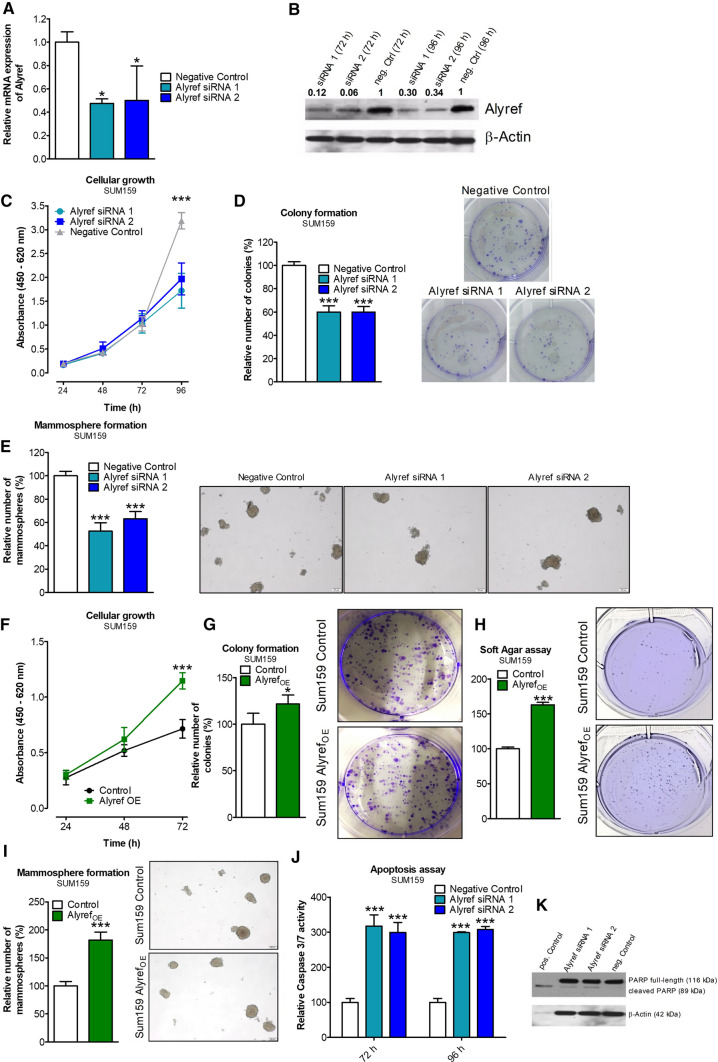
Fig. 2.
Cellular consequences of gain and loss of ALYREF function in triple-negative breast cancer cells. Verification of siRNA-mediated silencing efficiency of ALYREF in SUM159 cells on mRNA level (A) or protein level (B). Cellular growth assay in SUM159 cells over 96 h under control conditions (Negative Control siRNA; gray curve) or after siRNA-mediated knock-down of ALYREF (blue curves). n = 6, ± SD. ***p < 0.001. D Colony formation assay in SUM159 cells. Bar graphs on the left represent relative colony numbers under control conditions (Negative Control siRNA; white bars) or after siRNA-mediated ALYREF knock-down (blue bars). n = 3, ± SD. ***p < 0.001. Right panels depict corresponding representative pictures. E Mammosphere formation was analyzed either under control conditions (Negative Control siRNA; white bars) or after siRNA-mediated knock-down of ALYREF (blue bars) ten days after transfection. The relative numbers of spheres in ALYREF-silenced compared to control conditions are represented in the graphs. n = 3, ± SD. ***p < 0.001. Right panels depict representative pictures. F Cellular growth assay in SUM159 cells over 96 h under control conditions (black curve) or after overexpression of ALYREF (green curve). n = 6, ± SD. ***p < 0.001. G Colony formation assay in SUM159 cells under control conditions (white bars) or after ALYREF overexpression (green bar). n = 3, ± SD. *p < 0.05. Right panels depict corresponding representative pictures. H Soft agar assay in SUM159 cells under control conditions (white bars) or after ALYREF overexpression (green bar). n = 3, ± SD. ***p < 0.001. Right panels depict corresponding representative pictures. I Mammosphere formation was analyzed either under control conditions (white bar) or after overexpression of ALYREF (green bar) ten days after transfection. n = 3, ± SD. ***p < 0.001. Right panels depict representative pictures. J Caspase 3/7 assay either under control conditions (Negative Control siRNA, white bars) or after siRNA-mediated knock-down of ALYREF (blue bars) 72 and 96 h after transfection. n = 3, ± SD. ***p < 0.001. K Western Blot analysis of PARP shows the ratio of cleaved PARP to full-length PARP in ALYREF-silenced SUM159 cells 72 h after transfection. β-Actin was used as loading control and over-night staurosporine (1 µM) treatment as positive control. This figure contains data for SUM159 cells—data with the same experimental setup conducted in additional three TNBC cell lines can be found in the Supplementaries

