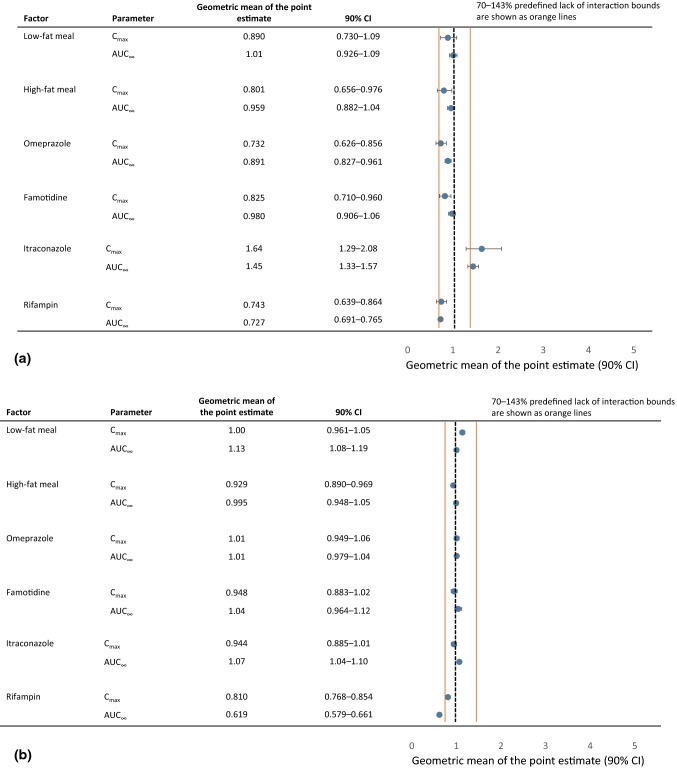
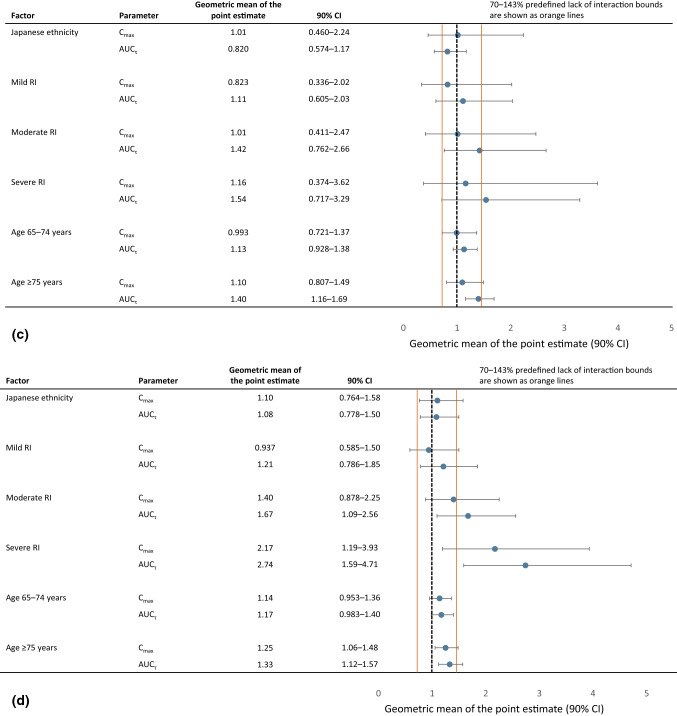
Fig. 3.
Effect of extrinsic factors on the pharmacokinetics of (a) filgotinib and (b) its primary metabolite; effect of intrinsic factors on the pharmacokinetics of (c) filgotinib and (d) its primary metabolite (geometric mean of the point estimate with 90% CIs). Geometric mean ratio for AUC∞ is shown when filgotinib was given as a single dose; geometric mean ratio of AUCτ is shown when filgotinib was given as multiple doses. AUC∞ area under the plasma concentration–time curve from time zero to infinity, AUCτ area under the plasma concentration–time curve during a dosage interval (τ), CI confidence interval, Cmax maximum (peak) plasma drug concentration, RI renal impairment


