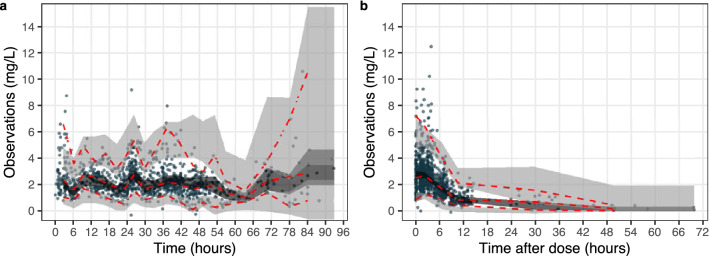
Fig. 2.
Prediction-corrected and variability-corrected visual predictive checks of the final model illustrating the pharmacokinetic profile over time (a) or over time after dose (b). The red dashed lines indicate the 97.5%, 50%, and 2.5% percentile of the observed data; the light gray area is the 95% prediction interval of the 97.5% or 2.5% percentile of the model predicted data, and the dark area is the 95% prediction interval of the 50% percentile of the model predicted data

