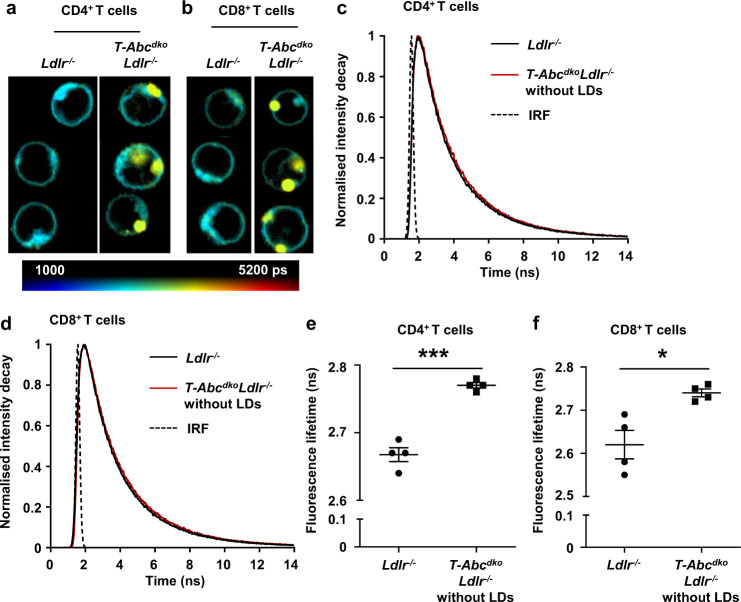
Fig. 1. T cell Abca1/Abcg1 deficiency leads to plasma membrane stiffening.
Ldlr−/− and T-AbcdkoLdlr−/− mice were fed a chow diet. Spleens were collected, CD4+ and CD8+ T cells were isolated, stained with BODIPY C10, and analyzed by Fluorescence-Lifetime Imaging Microscopy (FLIM). Representative microscopy pictures for CD4+ (a) and CD8+ (b) T cells. Scale bar represents picosec (ps). Representative fluorescence lifetime decay curves for CD4+ (c) and CD8+ (d) T cells. LDs, lipid droplets. Dashed lines represent fits with mono-exponential decay functions convoluted with the instrument response function (IRF). BODIPY C10 fluorescence lifetime (determined by fitting the fluorescence lifetime decay curves with a mono-exponential decay function) for the plasma membrane of (e) CD4+ (p = 0.00009) and (f) CD8+ (p = 0.013) T cells (without LDs). Per mouse, 43–76 CD4+ and CD8+ T cells were analyzed. n = 4 Ldlr−/− and n = 4 T-AbcdkoLdlr−/− mice. For all panels, error bars represent SEM. Biologically independent samples were included. p value was determined by unpaired two-tailed Student’s t test. *p < 0.05, ***p < 0.001. Source data are provided as a Source Data file.

