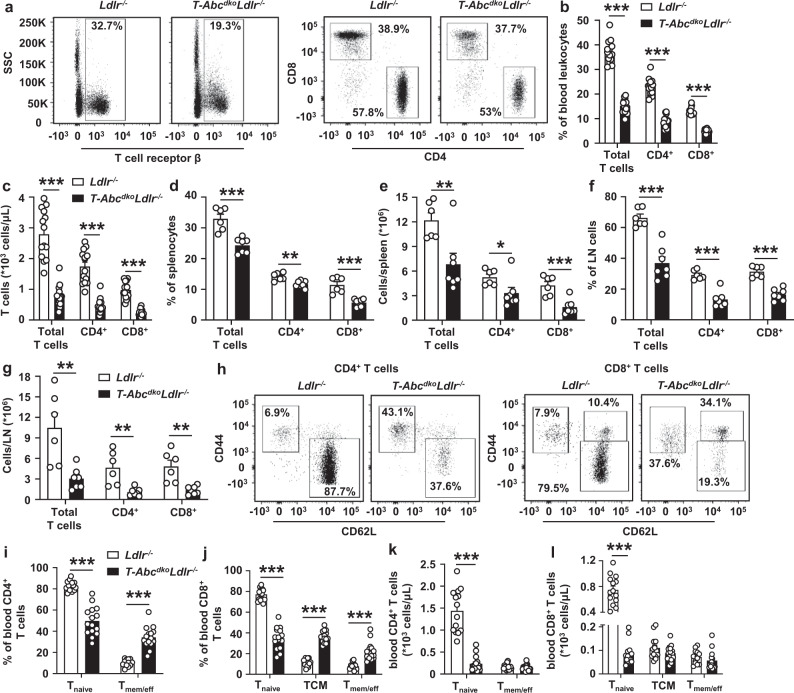
Fig. 2. T cell Abca1/Abcg1 deficiency decreases blood, splenic, and para-aortic lymph node T cells and increases T cell activation.
Ldlr−/− and T-AbcdkoLdlr−/− mice were fed a chow diet. Blood, spleens, and para-aortic lymph nodes (LNs) were collected. Cells were stained with the indicated antibodies and analyzed by flow cytometry. a Representative flow cytometry plots of T cell receptor β (TCRβ)+ (total T cells), CD4+, and CD8+ T cells gated as in Supplementary Fig. 6a. b Quantification of total (p < 0.000001), CD4+ (p < 0.000001), and CD8+ (p < 0.000001) T cells as percentage of total white blood cells (leukocytes). c Total (p < 0.000001), CD4+ (p < 0.000001), and CD8+ (p < 0.000001) T cell concentration in blood after correction for total blood leukocyte counts. n = 14 Ldlr−/− and n = 15 T-AbcdkoLdlr−/− mice. Total (p = 0.00039), CD4+ (p = 0.0030), and CD8+ (p = 0.00024) T cells as a percentage of total splenic cells (d) and total (p = 0.0087), CD4+ (p = 0.0420), and CD8+ (p = 0.00085) T cells as cells/spleen after correction for total splenic cell number (e). Total (p = 0.000084), CD4+ (p = 0.000037), and CD8+ (p = 0.000016) T cells as a percentage of total para-aortic LN cells (f) and total (p = 0.0044), CD4+ (p = 0.00297), and CD8+ (p = 0.0021) T cells as cells/LN after correction for total para-aortic LN cell number (g). d–g n = 6 Ldlr−/− and n = 7 T-AbcdkoLdlr−/− mice. Representative flow cytometry plots of (h) CD4+CD44−CD62L+ (Tnaive), CD44+CD62L− (Tmemory/effector (Tmem/eff)), CD8+ Tnaive, CD8+CD44+CD62L+ (Tcentral memory (TCM)), and Tmem/eff cells gated as in Supplementary Fig. 7a, (i, j) quantifications of CD4+ Tnaive (p < 0.000001) and Tmem/eff (p < 0.000001) cells (i) or CD8+ Tnaive (p < 0.000001), TCM (p < 0.000001), and Tmem/eff (p = 0.0000027) cells (j) as a percentage of CD4+ (i) or CD8+ (j) T cells, and (k, l) concentrations in blood for CD4+ Tnaive (p < 0.000001) and Tmem/eff cells (k) or CD8+ Tnaive (p < 0.000001), TCM, and Tmem/eff cells (l) after correction for total blood leukocyte counts. n = 14 Ldlr−/− and n = 15 T-AbcdkoLdlr−/− mice. b, i, j The experiments were performed twice with the same results. For all panels, error bars represent SEM. Biologically independent samples were included. p value was determined by unpaired two-tailed Student’s t test. *p < 0.05, **p < 0.01, ***p < 0.001. Source data are provided as a Source Data file.

