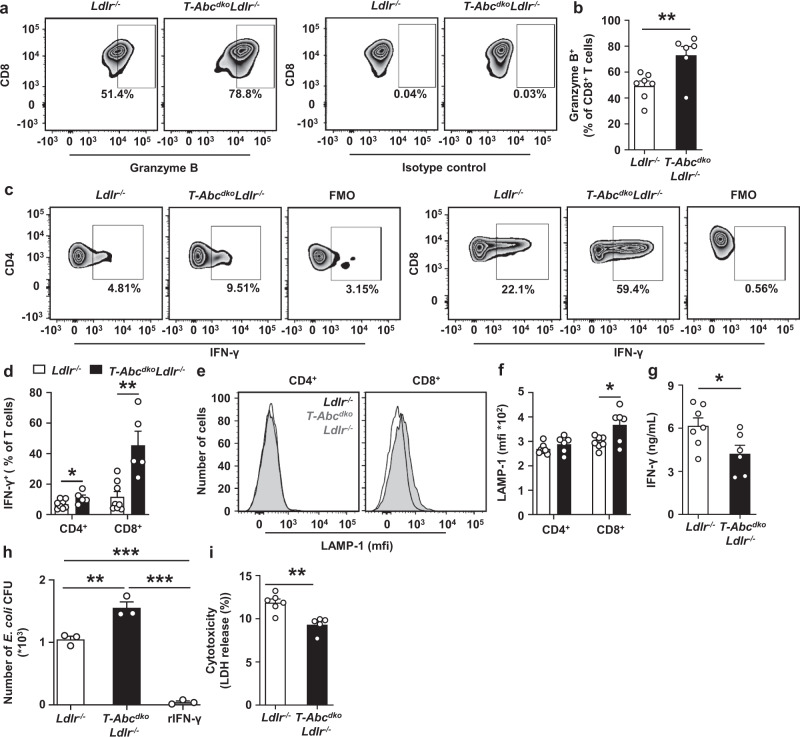
Fig. 4. Effects of T cell Abca1/Abcg1 deficiency on T cell functionality.
Splenic CD4+ a–f, CD8+ (a–f, j), or total T cells (g–i) were isolated from Ldlr−/− and T-AbcdkoLdlr−/− mice. a–f CD4+ and CD8+ T cells were stimulated with αCD3/IL-2 for 12 h, fixed, permeabilized, stained for granzyme B (a, b), or interferon gamma (IFN-γ) (c, d), or alternatively, stained for lysosomal-associated membrane protein-1 (LAMP-1) (e, f). Gating strategies are shown in Supplementary Fig. 14. Representative flow cytometry plots of (a) CD8+granzyme B+ (p = 0.0096), (c) CD4+IFN-γ+ (p = 0.048) and CD8+IFN-γ+ (p = 0.002) T cells and (b, d) quantification as a percentage of CD8+ T cells after correction for isotype control (b) and as a percentage of CD4+ or CD8+ T cells after correction for fluorescence minus one (FMO) control (d). e Representative flow cytometry plots and (f) quantification of LAMP-1 expression on CD4+ and CD8+ (p = 0.027) T cells. b, f n = 7 Ldlr−/− and n = 6 T-AbcdkoLdlr−/− mice. d n = 8 Ldlr−/− and n = 5 T-AbcdkoLdlr−/− mice. g T cells were stimulated with αCD3/IL-2 for 12 h. Medium was collected and IFN-γ levels (p = 0.034) were measured by ELISA. n = 7 Ldlr−/− and n = 6 T-AbcdkoLdlr−/− mice. h Wild-type bone marrow derived macrophages (BMDMs) were incubated with conditioned medium from CD8+ T cells stimulated with αCD3/IL-2 for 12 h, or recombinant IFN-γ (rIFN-γ; positive control) for 3 days. After medium removal, BMDMs were co-incubated with E. coli for 1 h, washed, incubated with gentamicin for 3 h, washed, and lysed. BMDM lysates were plated on agar overnight and E. coli colony forming units (CFU) were counted (Ldlr−/− vs T-AbcdkoLdlr−/−, p = 0.0032; Ldlr−/− or T-AbcdkoLdlr−/− vs rIFN-γ, p < 0.0001). n = 3 Ldlr−/− and n = 3 T-AbcdkoLdlr−/− mice. i BMDMs were co-incubated with T cells in the presence of αCD3/IL-2 (to stimulate T cells) for 24 h. Medium was collected and endogenous lactate dehydrogenase (LDH) was assessed (p = 0.0023). n = 6 Ldlr−/− and n = 5 T-AbcdkoLdlr−/− mice. For all panels, error bars represent SEM. Biologically independent samples were included. p value was determined by unpaired two-tailed Student’s t test (a–i) or one-way ANOVA with Bonferroni post-test (j). *p < 0.05, **p < 0.01, ***p < 0.001. Source data are provided as a Source Data file.

