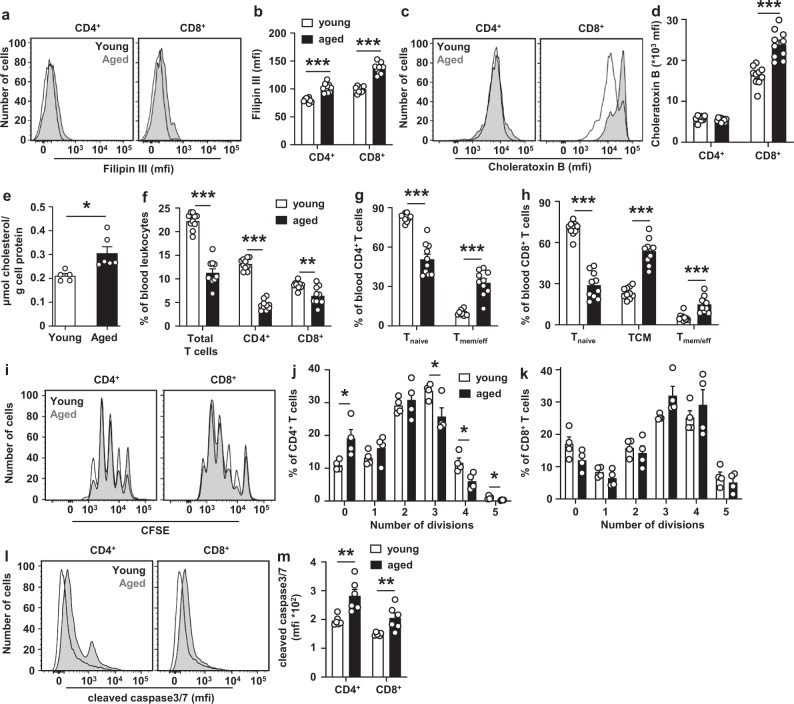
Fig. 5. Aging increases cholesterol accumulation and apoptosis in T cells.
Blood and spleens from young (3 months) and aged (24 months) wild-type mice fed a chow diet were collected. Filipin (a, b) and choleratoxin B (c, d) stainings on blood T cells. a Representative flow cytometry plots of filipin staining on CD4+ (p < 0.000001) and CD8+ (p < 0.000001) T cells gated as in Supplementary Fig. 1e and (b) quantification. c Representative flow cytometry plots of choleratoxin B staining on CD4+ and CD8+ (p = 0.00002) T cells gated as in Supplementary Fig. 2c and (d) quantification. b, d n = 10 young and n = 10 aged wild-type mice. e Splenic T cells were isolated and total cholesterol (p = 0.013) was measured by Gas Chromatography – Mass Spectrometry. n = 5 young and n = 6 aged wild-type mice. f Total (p < 0.000001), CD4+ (p < 0.000001), and CD8+ (p = 0.0026) T cells as a percentage of total blood leukocytes. Tnaive (p < 0.000001) and Tmem/eff (p < 0.000001) cells as a percentage of CD4+ (g) and Tnaive (p < 0.000001), Tmem/eff (p < 0.000001), and TCM (p = 0.00016) cells as a percentage of CD8+ T cells (h) in blood. f–h n = 10 young and n = 10 aged wild-type mice. i–m Splenic total, CD4+, and CD8+ T cells were isolated. i–k T cells were labeled with CFSE and stimulated with αCD3/αCD28 beads. CFSE dilution was measured by flow cytometry at 72 h after stimulation. i Representative CFSE dilutions gated as in Supplementary Fig. 11c and quantification of the number of divisions of (j) CD4+ (division 0, p = 0.030; 3, p = 0.035; 4, p = 0.023; 5, p = 0.026) and (k) CD8+ T cells. n = 4 young and n = 4 aged wild-type mice. l–m CD4+ and CD8+ T cells were stimulated with αCD3/IL-2 for 12 h with concomitant staining for cleaved caspase 3/7. I Representative flow cytometry plots of cleaved caspase 3/7 in CD4+ (p = 0.004) and CD8+ (p = 0.009) T cells gated as in Supplementary Fig. 12d and (m) quantification. n = 6 young and n = 6 aged wild-type mice. For all panels, error bars represent SEM. Biologically independent samples were included. p value was determined by unpaired two-tailed Student’s t test. *p < 0.05, **p < 0.01, ***p < 0.001. Source data are provided as a Source Data file.

