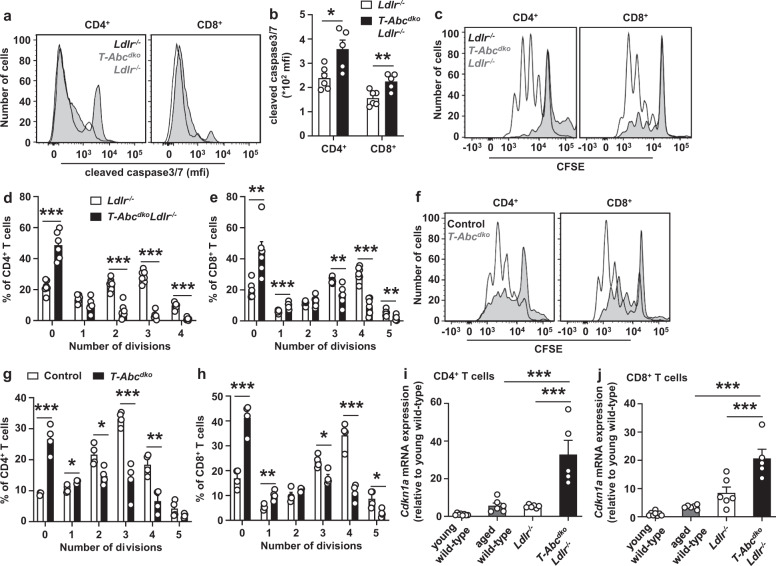
Fig. 6. T cell Abca1/Abcg1 deficiency induces a premature T cell aging phenotype.
Ldlr−/− and T-AbcdkoLdlr−/− mice (a–e, i–j) and control (Ldlr+/+) and T-Abcdko mice (f–h) were fed a chow diet for 12–13 months, and wild-type mice for 3 months (young) or 24 months (aged) (i–j). a–j Spleens were collected and CD4+ and CD8+ T cells were isolated. a, b CD4+ and CD8+ T cells were stimulated with αCD3/IL-2 for 12 h with concomitant staining for cleaved caspase3/7. a Representative flow cytometry plots of cleaved caspase 3/7 in CD4+ (p = 0.015) and CD8+ (p = 0.007) T cells gated as in Supplementary Fig. 12d and (b) quantification. n = 6 Ldlr−/− and n = 5 T-AbcdkoLdlr−/− mice. c–h T cells were labeled with CFSE and stimulated with αCD3/αCD28 beads. CFSE dilution was measured by flow cytometry at 72 h after stimulation. c, f Representative CFSE dilutions gated as in Supplementary Fig. 11c. The number of divisions were quantified for (d) CD4+ (division 0, p = 0.000017; 2, p = 0.00002; 3, p < 0.000001; 4, p < 0.000001) and (e) CD8+ (division 0, p = 0.0029; 1, p = 0.00095; 3, p = 0.0023; 4, p = 0.0000097; 5, p = 0.008) T cells. n = 7 Ldlr−/− and n = 6 T-AbcdkoLdlr−/− mice. The number of divisions were quantified for (g) CD4+ (division 0), p = 0.0002; 1, p = 0.013; 2, p = 0.017; 3, p = 0.00067; 4, p = 0.0031 and (h) CD8+ T cells (division 0, p = 0.0004; 1, p = 0.0056; 3, p = 0.012; 4, p = 0.0003; 5, p = 0.02). n = 4 control and n = 4 T-Abcdko mice. i–j T cells were isolated and RNA was extracted. Cyclin dependent kinase inhibitor 1a (Cdkn1a) mRNA expression was measured in (i) CD4+ (Ldlr−/− or aged wild-type vs T-AbcdkoLdlr−/−, p < 0.0001) and (j) CD8+ (Ldlr−/− vs T-AbcdkoLdlr−/−, p=0.0003; aged wild-type vs T-AbcdkoLdlr−/−, p < 0.0001) T cells by qPCR and shown as fold change compared to young wild-type mice. n = 8 young wild-type, n = 6 aged wild-type, n = 6 Ldlr−/−, and n = 5 T-AbcdkoLdlr−/− mice. For all panels, error bars represent SEM. Biologically independent samples were included. p value was determined by unpaired two-tailed Student’s t test (b, d–e, g, h) or one-way ANOVA with Bonferroni post-test (i, j). *p < 0.05, **p < 0.01, ***p < 0.001. Source data are provided as a Source Data file.

