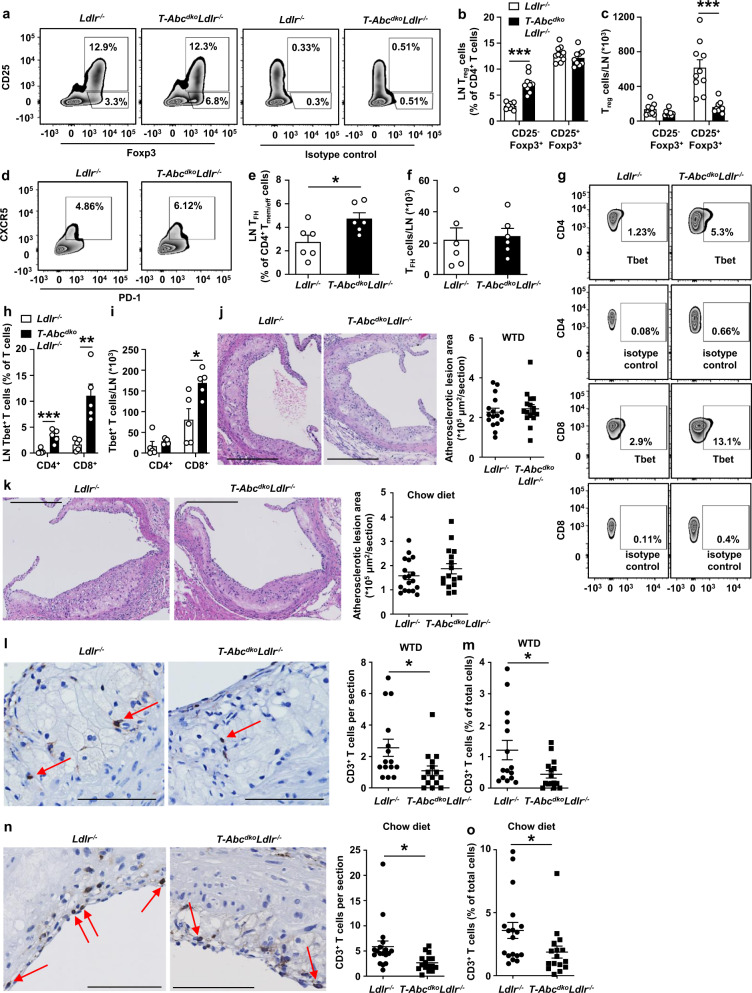
Fig. 7. Effects of T cell Abca1/Abcg1 deficiency on para-aortic LN T cell subsets and atherosclerosis in Ldlr−/− mice.
Female Ldlr−/− and T-AbcdkoLdlr−/− mice were fed chow diet for 28 weeks (a–i, k, n–o) or WTD for 10 weeks (j, l–m). a–i Para-aortic LNs were isolated, stained with the indicated antibodies, and analyzed by flow cytometry. Gating strategies are shown in Supplementary Fig. 18. a Representative flow cytometry plots and (b) quantification of CD25−Foxp3+ (p = 0.000001) and CD25+Foxp3+ Treg cells as a percentage of CD4+ T cells after correction for isotype control. c CD25−Foxp3+ and CD25+Foxp3+ Treg cells (p = 0.00026) as cells/LN after correction for total LN cells. n = 10 Ldlr−/− and n = 9 T-AbcdkoLdlr−/− mice. d Representative flow cytometry plots and (e) quantification of CD4+CD44+CD62L− C-X-C chemokine receptor type 5 (CXCR5)+ programmed cell death 1 (PD-1)+ Tfollicular helper (TFH) cells (p = 0.023) as a percentage of CD4+ Tmem/eff cells, and (f) as cells/LN. n = 6 Ldlr−/− and n = 6 T-AbcdkoLdlr−/− mice. g Representative flow cytometry plots and (h) quantification of CD4+Tbet+ (p = 0.00099) and CD8+Tbet+ (p = 0.0036) T cells as percentages of CD4+ and CD8+ T cells after correction for isotype control. i CD4+Tbet+ and CD8+Tbet+ (p = 0.0188) T cells as cells/LN. n = 5 Ldlr−/− and n = 5 T-AbcdkoLdlr−/− mice. Hearts were isolated and paraffin sections of the aortic root were stained for (j, k) haematoxylin-eosin (H&E) or (l-o) CD3. Representative pictures of H&E staining and quantification of atherosclerotic lesion area for WTD-fed (j) or chow diet-fed (k) mice. Scale bar represents 300 μm. Representative pictures and quantification of CD3+ cells per section for WTD-fed (p = 0.027) (l) or chow diet-fed (p = 0.0153) (n) mice. CD3+ cells are depicted by arrows. Scale bar represents 80 μm. CD3+ T cells as percentage of total cells per section for WTD-fed (p = 0.027) (m) or chow diet-fed (p = 0.043) mice (o). j n = 16 Ldlr−/− and n = 16 T-AbcdkoLdlr−/− mice. k, n, o n = 18 Ldlr−/− and n = 16 T-AbcdkoLdlr−/− mice. l–m n = 15 Ldlr−/− and n = 15 T-AbcdkoLdlr−/− mice. For all panels, error bars represent SEM. Biologically independent samples were included. p value was determined by unpaired two-tailed Student’s t test. *p < 0.05, **p < 0.01, ***p < 0.001. Source data are provided as a Source Data file.

