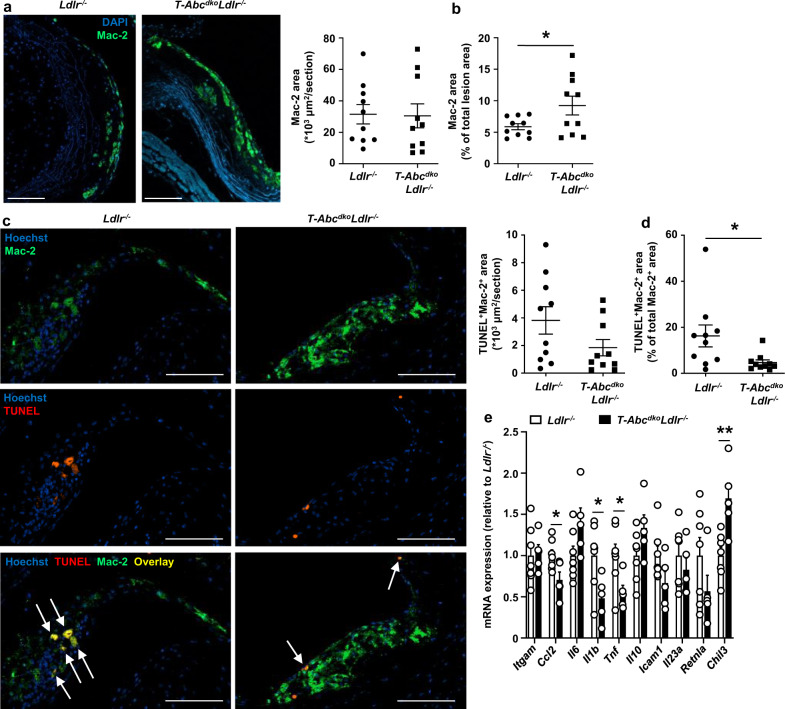
Fig. 9. T cell Abca1/Abcg1 deficiency increases macrophage content in atherosclerotic lesions from middle-aged Ldlr−/− mice.
Ldlr−/− and T-AbcdkoLdlr−/− mice were fed a chow diet for 12–13 months. a–d Hearts were isolated and paraffin sections of the aortic root were stained for (a–c) Mac-2 and DAPI, or (d–f) Mac-2, Terminal deoxynucleotidyl transferase dUTP nick end labeling (TUNEL), and Hoechst. a Representative pictures of Mac-2 staining (left) and quantification (right) of total Mac-2+ area. b Mac-2+ area as a percentage of total atherosclerotic lesion area (p = 0.046). a, b n = 10 Ldlr−/− and n = 10 T-AbcdkoLdlr−/− mice. c Representative pictures of Mac-2 and TUNEL stainings (left) and quantification (right) of total TUNEL+Mac-2+ area. Apoptotic macrophages were identified as Mac-2+TUNEL+ and are depicted by arrows. d TUNEL+Mac-2+ area as a percentage of total Mac-2+ area (p = 0.030). c, d n = 10 Ldlr−/− and n = 10 T-AbcdkoLdlr−/− mice. a, c Scale bar represents 100 μm. e Aortas from Ldlr−/− and T-AbcdkoLdlr−/− mice were collected, CD3− cells were isolated, RNA was extracted, and integrin subunit alpha M (Itgam), CC-chemokine ligand 2 (Ccl2) (p = 0.028), Il6, Il1b (p = 0.030), Tnf (p = 0.033), Il10, intracellular adhesion molecule-1 (Icam1), Il23a, resistin-like alpha (Retnla), and chitinase-like 3 (Chil3) (p = 0.0056) mRNA expression were measured by qPCR. n = 7 Ldlr−/− and n = 5 T-AbcdkoLdlr−/− mice. For all panels, error bars represent SEM. Biologically independent samples were included. p value was determined by unpaired two-tailed Student’s t test. *p < 0.05. Source data are provided as a Source Data file.

