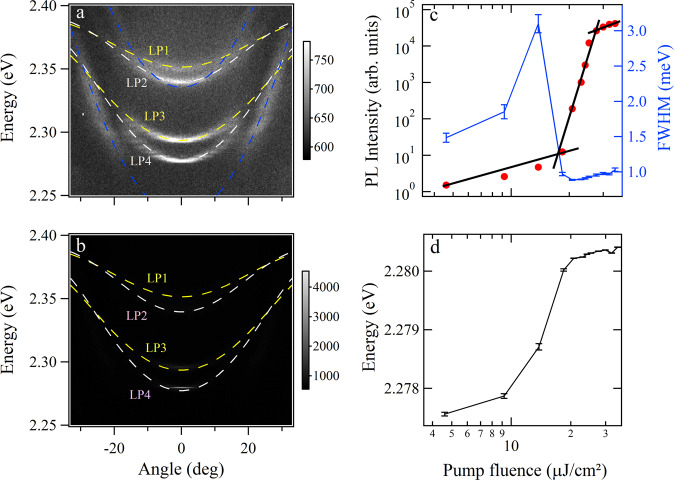
Fig. 2. Polariton condensation in the LC microcavity.
a The photoluminescence dispersion of the microcavity below the threshold and (b) the condensate spectrum above the threshold for voltage of 2 V. c Integrated intensity and linewidth as a function of the pump fluence. d Polariton energy peak position as a function of the pump fluence. The error bars in (c) are deviations of the estimated linewidth of polariton modes. And the error bars in (d) are deviations of the estimated energy of polariton modes. The blue dashed lines in (a) are a guide for the eye to show the modes with large curvature. LP1-LP4 denote low branch polaritons 1–4.

