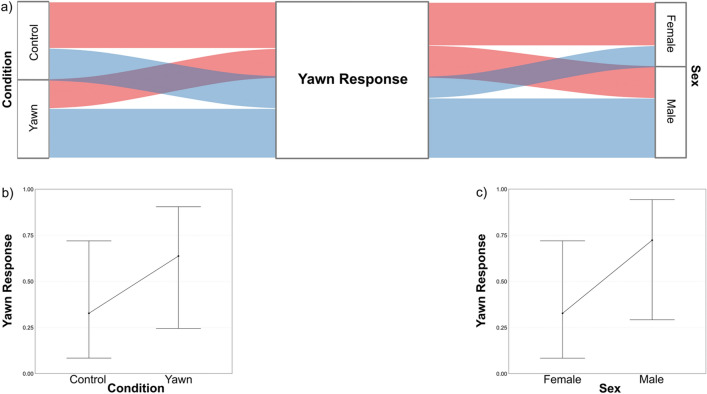
Figure 2.
Results of Model1c (Yawn Response as response variable) showing the effect of the significant predictors. (a) Alluvial plot showing the occurrence of Yawn Response (Blue streams = presence; Pink streams = absence) for each level of the factors “Condition” (Yawn vs Control) and “Sex” (Male vs Female). (b) Effect of the variable Condition on the Yawn response. (c) Effect of the variable Sex on the Yawn Response. Bands represent the confidence interval.

