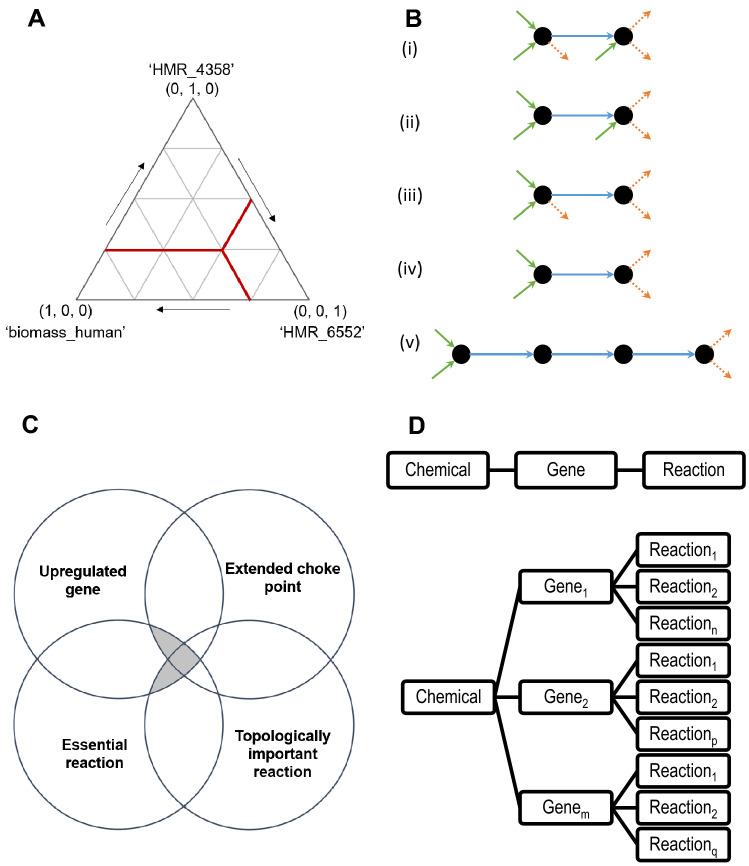
Figure 2.
Strategies to identify gene targets for drug repurposing. (A) Simplex lattice design for objective function weight values distribution. Each outer vertex represents a case where a single objective function is selected: maximization of the biomass yield (‘biomass_human’), maximization of the ATP yield (‘HMR_4358’), and maximization of 1-phosphatidyl-1D-myo-inositol-4-phosphate production (‘HMR_6552’). For illustrative purposes, the test comprising weight values (0.25, 0.25, 0.50) is labeled in red. (B) Examples of metabolites-reactions relationships (dots and arrows, respectively). The blue arrows represent the production of the metabolite on the right from the metabolite on the left. Inward green arrows refer to production reactions from metabolites not drawn, while outward orange dotted arrows represent consumption reactions. (i) Not a choke point, (ii) single choke point on the consumption side, (iii) single choke point on the production side, (iv) double choke point, and (v) extended choke point. (C) Venn diagram showing the subsets of reactions of interest. In all cases, reactions (metabolic or of transport) were essential and carried out by proteins related to upregulated genes, as well as identified as extended choke point and/or topologically important reactions. (D) (Top) Direct chemical–gene interaction, where a compound affects the activity of a single protein (e.g., an inhibitor). (D) (Bottom) Indirect chemical–gene interaction, where a single compound targets an element such as a signaling protein, that leads to changes in the expression levels of multiple genes, thus affecting several reactions in a pleiotropic manner.

