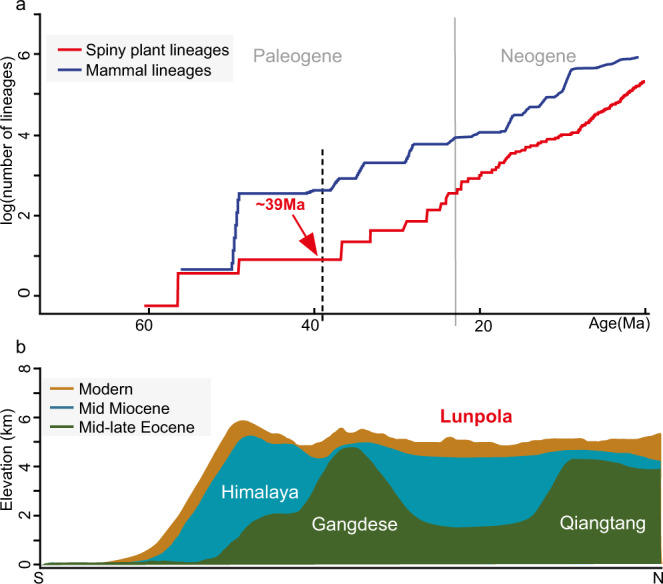
Fig. 3. The lineage accumulation curve of spiny plants in Asia and the elevational changes of central Tibetan Plateau.

a The red line represents a log plot of lineage accumulation of spiny plants in eudicots in Eurasia during the Cenozoic. The blue curve represents a log plot of lineage accumulation of mammalian herbivore species in central Asia during the Cenozoic. Being log plots, the linear rise is indicative of exponential diversification. Source data are provided as Source Data files. b South (left) to north (right) transects of mean elevation changes across Himalaya-Tibet at different phases in its geological evolution (modified from Su, et al.51).
