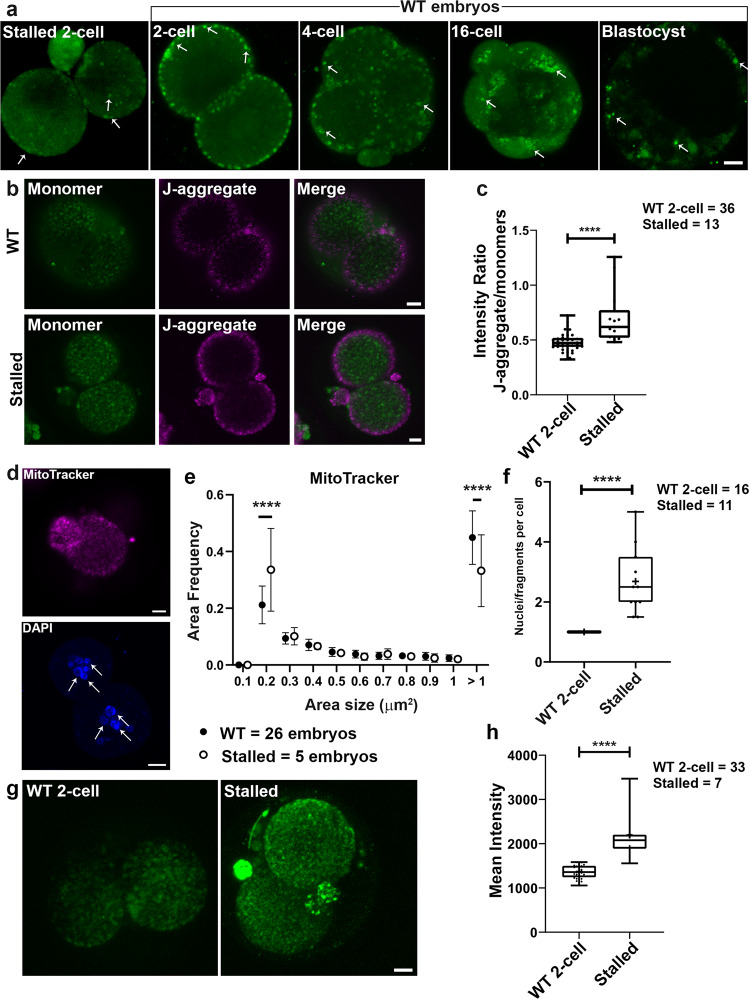
Fig. 5. Loss of Ddx1 leads to increased mitochondrial membrane potential and mitochondrial ROS.
One-cell embryos from Ddx1 heterozygote crosses were cultured in M16 medium for 72 h. One-cell embryos from Ddx1 wild-type crosses were cultured for up to 96 h. Images were captured with a Zeiss LSM710 confocal microscope. a Fluo-4 AM staining (green) of stalled 2-cell embryos and wild-type 2-cell, 4-cell, 16-cell and blastocyst embryos. Three independent wild-type crosses were used for each stage with the exception of blastocysts where 2 crosses were used. Similar results were obtained for all embryos at the same stage. Arrows point to Fluo-4 AM staining in embryos. b JC-1 staining of stalled and wild-type 2-cell embryos. Stalled embryos have a stronger J-aggregate (magenta)/monomer (green) signal ratio compared to wild-type embryos indicating that the mitochondrial membrane potential is higher in stalled embryos. Single plane images are shown to better illustrate high potential mitochondria distribution. c Statistical analysis of mitochondrial membrane potential in wild-type (n = 36) and stalled (n = 13) embryos. Mean intensity values were plotted with Prism. Statistical analysis was performed with two-sided Students’ t-test. ****indicates p < 0.0001 (with the exact p = 2.24E-05). Center line, median; box limits, 25th and 75th percentiles; whiskers, minimum to maximum. Error bars represent standard deviation. d Mitochondrial (top) and nuclear (bottom) fragmentation detected in stalled embryos. Arrows point to fragmented nuclei. Maximum intensity projections of the Z-stack images are shown for DAPI (MitoTracker, magenta; DAPI, blue). e The reduced size of MitoTracker Deep Red aggregates suggests fragmentation of mitochondria. Data were plotted with Prism. Statistical analysis was performed with two-sided multiple t-test using the Holm-Sidak method, with alpha = 0.05. ****indicates p < 0.0001 (both p values were less than 1E-06). Each circle represents the mean value, and the error bars represent standard deviation. Solid circles represent wild-type controls; empty circles represent stalled embryos. f The number of nuclei (or nuclei fragments) per cell was quantified and plotted with Prism. Statistical analysis was performed with two-sided Students’ t-test. ****indicates p < 0.0001 (with the exact p = 1.92E-06). Center line, median; box limits, 25th and 75th percentiles; whiskers, minimum to maximum. Error bars represent standard deviation. g Mitochondrial ROS in wild-type and stalled 2-cell embryos was detected using the MitoSOX dye (green). Maximum intensity projections of the Z-stack images at each stage are shown. h Data obtained from (g) were plotted with Prism. Statistical analysis was performed with two-sided Students’ t-test. ****indicates p < 0.0001 (with the exact p = 1.59E-08). Center line, median; box limits, 25th and 75th percentiles; whiskers, minimum to maximum. Error bars represent standard deviation. Scale bars = 10 µm. Z-stack images of each embryo was used for the statistical analysis in (c), (f) and (h). Single plane images of each embryo (middle sections) were used for the statistical analysis in (e). WT = wild-type.

