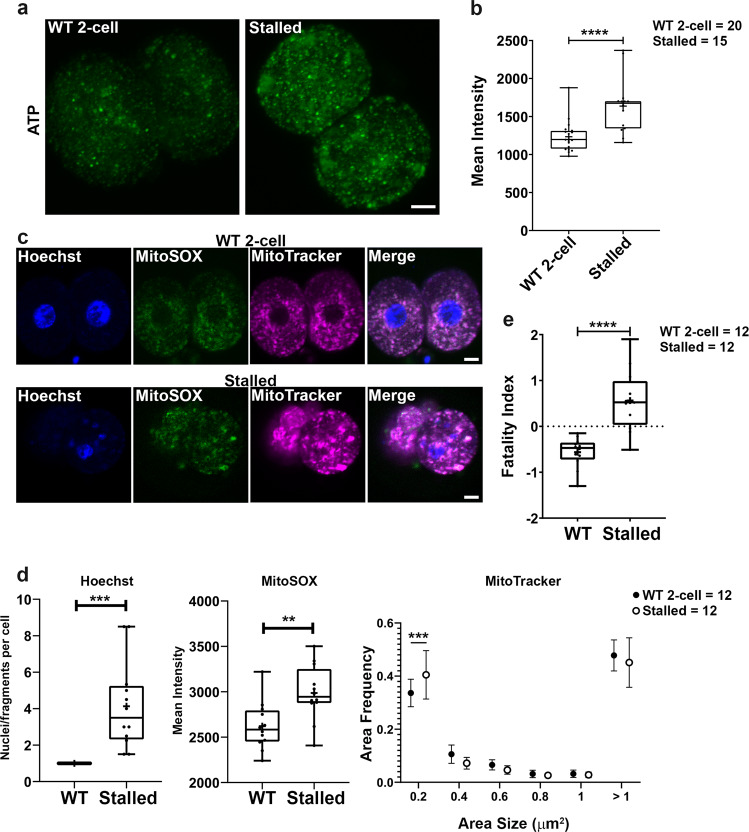
Fig. 6. Loss of Ddx1 leads to higher ATP levels and a higher fatality index.
One-cell embryos from Ddx1 heterozygote crosses were cultured for 72 h. One-cell embryos from Ddx1 wild-type crosses cultured to the 2-cell stage were used for comparison. a BioTracker ATP-red staining (green) of stalled 2-cell embryos show higher ATP levels compared to wild-type 2-cell embryos. Maximum intensity projections of the Z-stack images at each stage are shown. b Statistical analysis of (a) using Z-stack images for each embryo. Mean intensity values were plotted with Prism. Statistical analysis was performed with two-sided Students’ t-test. ***indicates p < 0.001 (with the exact p = 1.34E-04). Center line, median; box limits, 25th and 75th percentiles; whiskers, minimum to maximum. Error bars represent standard deviation. c Triple staining of nuclei (Hoechst 33342) (blue), mtROS (MitoSOX) (green) and mitochondria (MitoTracker) (magenta) in stalled versus wild-type two-cell embryos. d Stalled embryos have higher mtROS and more fragmented nuclei and mitochondria based on statistical analysis of each channel in (c) plotted individually. Statistical analysis was performed with either two-sided Students’ t-test or two-sided multiple t-test using the Holm-Sidak method, with alpha = 0.05. ***indicates p < 0.001. **indicates p < 0.01. Exact p value for left panel is 0.0002, center panel is 0.0045, and right panel is 0.00045. For the box plots, center line, median; box limits, 25th and 75th percentiles; whiskers, minimum to maximum. Error bars represent standard deviation. For the symbol plot, each circle represents the mean value, and the error bars represent standard deviation. Solid circles represent wild-type controls; empty circles represent stalled embryos. e Statistical analysis of fatality index constructed with weighted average index construction using the z-scores of nuclei (or nuclei fragments) number/cell, MitoSOX intensity and percentage of mitochondria with size <0.2 µm2, and plotted with Prism. Statistical analysis was performed with two-sided Students’ t-test. ****indicates p < 0.0001 (with the exact p = 2.66E-05). Center line, median; box limits, 25th and 75th percentiles; whiskers, minimum to maximum. Error bars represent standard deviation. Scale bars = 10 µm. Numbers of embryos analysed are indicated on the right hand side. WT = wild-type. Z-stack images were used for statistical analysis of nuclei and mtROS whereas single plane images of each embryo (middle sections) were used for statistical analysis of mitochondria.

