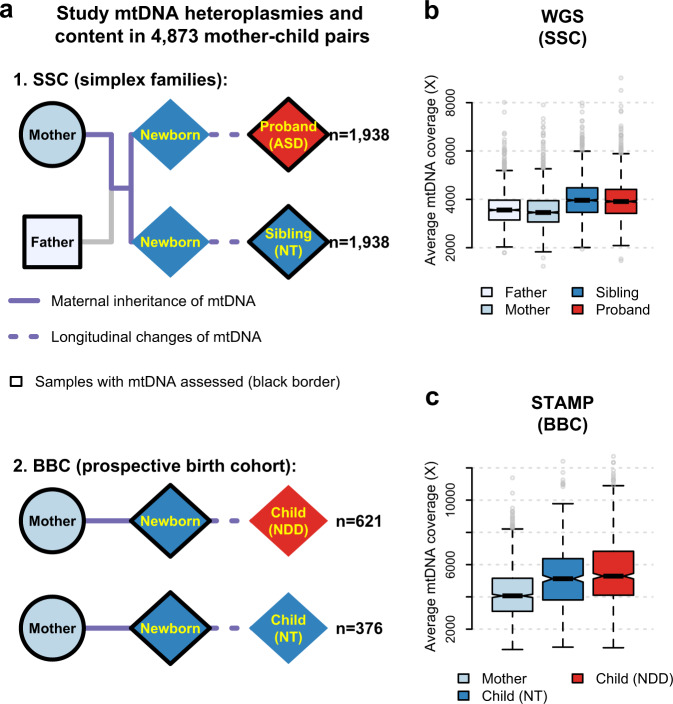
Fig. 1. Study design and mtDNA evaluation in the SSC and BBC.
a A schematic diagram of families (mother, father, sibling, and proband with ASD) in the SSC (n = 1938) and mother-child dyads in the BBC (n = 997). The square, circle, and diamond represent male, female, and both sexes, respectively. For both the SSC and BBC, the inter-generational transmission of mtDNA is represented by solid lines and the individual child longitudinal change in mtDNA is illustrated by dotted lines. b, c Box plots for the average mtDNA sequencing coverage among 1938 families in the SSC (as illustrated in a) using whole-genome sequencing (WGS) (b), and among 997 dyads of mothers and children in the BBC (as illustrated in a) using mtDNA-targeted sequencing (STAMP) (c). Box plots in b and c show the median as the center line, 95% confidence interval of the median as the notch, the first (Q1) and third (Q3) quartiles as the boundaries of the box, the values of the largest and smallest data points within the range between Q1–1.5× interquartile range (IQR) and Q3 + 1.5× IQR as the boundaries of the whiskers, and the outliers beyond this range as the gray points. ASD: autism spectrum disorder; NT: neurotypical; NDD: neurodevelopmental disorder.

