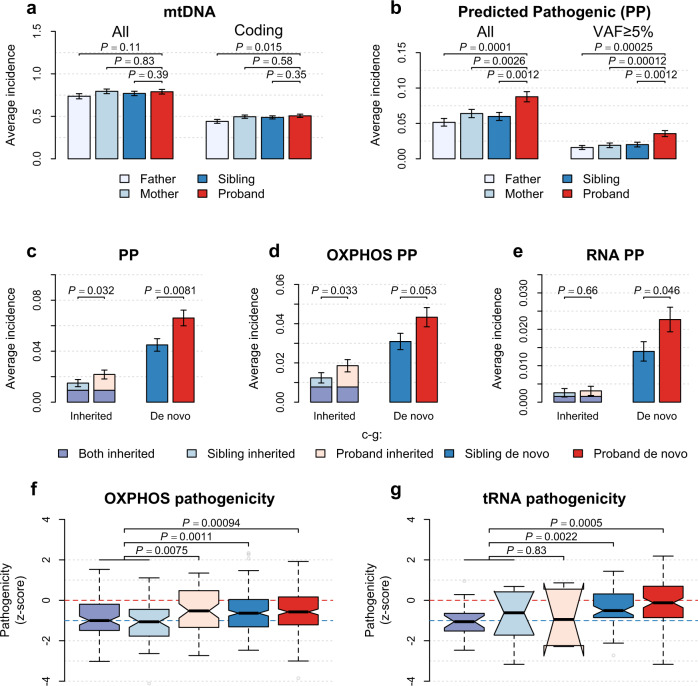
Fig. 2. mtDNA heteroplasmies in the SSC.
a, b Bar plots for the average number of heteroplasmies per participant a for all mtDNA heteroplasmies and heteroplasmies in the coding region, respectively; and b for predicted pathogenic (PP) heteroplasmies. (c) Bar plots for the average number of inherited and de novo PP heteroplasmies in probands and siblings. d, e Bar plots for the average number of PP heteroplasmies in oxidative phosphorylation (OXPHOS) genes (d) and in RNA genes (e) among probands and siblings. Data in bar plots (a–e) are mean ± SEM among 1938 families in the SSC as illustrated in Fig. 1a. Distributions of the number of mtDNA heteroplasmies per participant in a and b are shown in Supplementary Fig. 1. Two-sided P values from conditional logistic regression are shown. f, g Box plots for the distribution of pathogenicity z-scores among nonsynonymous heteroplasmies (from left to right, n = 89, 58, 65, 221, and 229) in OXPHOS genes (f) and among heteroplasmies (from left to right, n = 21, 10, 6, 67, and 102) in tRNA genes (g), to illustrate weakened effects of purifying selection on mtDNA heteroplasmies among children with ASD relative to their siblings. Box plots in f and g show the median as the center line, 95% confidence interval of the median as the notch, the first (Q1) and third (Q3) quartiles as the boundaries of the box, the values of the largest and smallest data points within the range between Q1–1.5× interquartile range (IQR) and Q3 + 1.5× IQR as the boundaries of the whiskers, and the outliers beyond this range as the gray points. P values (two-sided) in f and g are from the unpaired t test.

