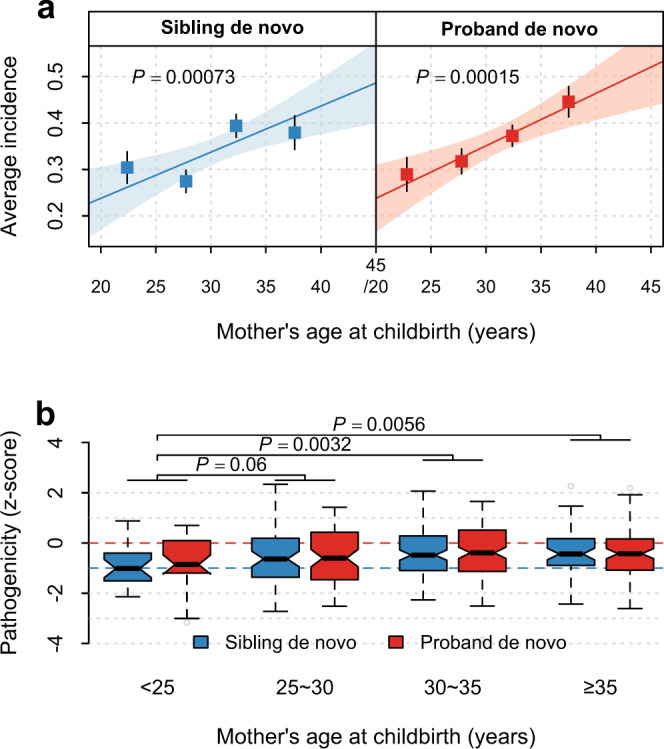
Fig. 3. Influence of maternal age at childbirth on de novo heteroplasmies in the SSC.

a Maternal age-dependent increase in the number of de novo heteroplasmies in siblings and probands. Points and error bars in each subpanel represent mean ± SEM among the four maternal-age groups (from left to right, n = 217, 514, 665, and 327 siblings, and n = 197, 542, 725, and 471 probands). 215 siblings and 3 probands with missing maternal age information were excluded from the analyses in (a) and (b). The P value (two-sided) and the shaded area indicate the significance of the slope and the 95% confidence interval of the linear regression line (the solid line), respectively. No significant difference in slope was found between cases and controls, as shown in Supplementary Table 12. b Box plots for the distribution of pathogenicity z-scores of de novo heteroplasmies at nonsynonymous sites in oxidative phosphorylation genes or at all sites in tRNA genes stratified by maternal age groups at birth (from left to right, n = 23, 63, 113, and 53 in siblings, and n = 29, 73, 133, and 93 in probands). Two-sided P values are from linear regression. Box plots show the median as the center line, 95% confidence interval of the median as the notch, the first (Q1) and third (Q3) quartiles as the boundaries of the box, the values of the largest and smallest data points within the range between Q1–1.5× interquartile range (IQR) and Q3 + 1.5× IQR as the boundaries of the whiskers, and the outliers beyond this range as the gray points.
