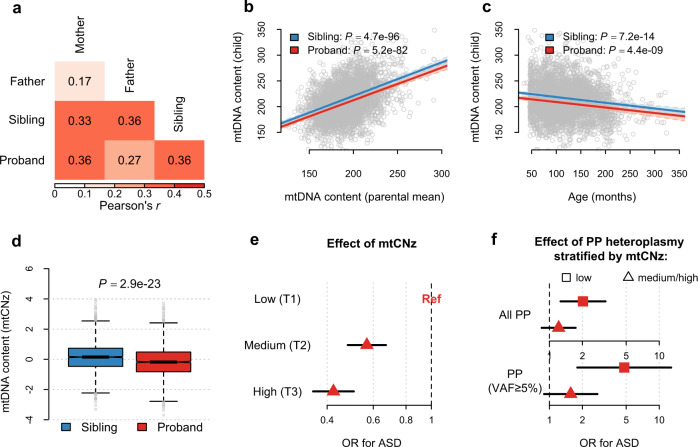
Fig. 4. mtDNA content in the SSC.
All analyses were performed in 1938 families of the SSC as illustrated in Fig. 1a. a Pearson’s correlation coefficients of mtDNA content between the father, mother, sibling and proband. b Scatter plots for mtDNA content in siblings and probands in relation to the mean values of mtDNA content in their parents. c Scatter plots for mtDNA content in siblings and probands in relation to their age at the time of sample collection. 215 siblings with missing age information were excluded. In b and c, the solid lines represent the linear regression lines estimated among siblings and probands, respectively, and the P value (two-sided) indicates the significance of the slope. d Box plots for the distribution of mtDNA content z-scores (mtCNz) in siblings and probands. All box-plot elements are defined in the same way as in Fig. 1. The P value (two-sided) was obtained from conditional logistic regression, where ASD is the outcome and mtCNz is the predictor. e Forest plots for the effects of mtCNz on ASD risk. The low-tertile group (T1) of mtCNz served as the reference group. f Forest plots for the effects of predicted pathogenic (PP) heteroplasmies on ASD risk among children with low mtCNz (the low-tertile group; T1) vs. medium/high mtCNz (the middle- or high-tertile group; T2/T3). The upper subpanel and lower subpanel show the results for all PP heteroplasmies and PP heteroplasmies with variant allele fraction (VAF) ≥ 5%, respectively. Horizontal black lines represent the 95% confidence interval (CI) of the estimated odds ratio (OR). Values on the x axis are shown on a logarithmic scale.

