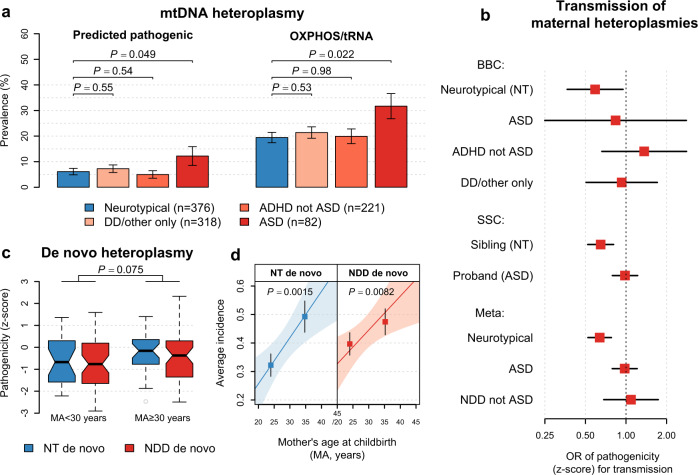
Fig. 6. Replication of findings on mtDNA heteroplasmy prevalence and transmission as well as maternal age effect in the BBC.
a Bar plots for the family-adjusted prevalence of predicted pathogenic (PP) heteroplasmies and heteroplasmies at nonsynonymous sites in oxidative phosphorylation genes or at all sites in tRNA genes (OXPHOS/tRNA), respectively. Error bars represent bootstrapped SEM. Two-sided P values are from logistic regression further adjusted for mtDNA content z-score. b Forest plots for the effects of per standard deviation increase in pathogenicity z-score on transmission of maternal mtDNA heteroplasmies to the child. Horizontal black lines represent the 95% confidence interval of the odds ratio (OR) among children indicated by the label on the y axis (from top to bottom, BBC: n = 376, 82, 221, and 318 children; SSC: n = 1938 siblings and 1938 probands; Meta: n = 2314, 2020, and 539 children). Combined effects were estimated based on a fixed-effect meta-analysis (Meta) of the results from the SSC and BBC. Values on the x axis are shown on a logarithmic scale. c Box plots for the distribution of pathogenicity z-scores among de novo heteroplasmies (from left to right, NT: n = 24, 30; NDD: n = 52, 50) in children born to mothers aged below and above 30 years. Two-sided P values are from linear regression. All box-plot elements are defined in the same way as in Fig. 1. d Maternal age-dependent increase in the number of de novo heteroplasmies. Points and error bars represent mean ± SEM among children (from left to right, NT: n = 242, 134; NDD: n = 368, 253) in the two maternal-age groups in (c). The P value (two-sided) and the shaded area indicate the significance of the slope and the 95% confidence interval of the linear regression line (the solid line), respectively. ASD: autism spectrum disorder; ADHD: attention-deficit/hyperactivity disorder; DD: developmental delay; NDD: neurodevelopmental disorder.

