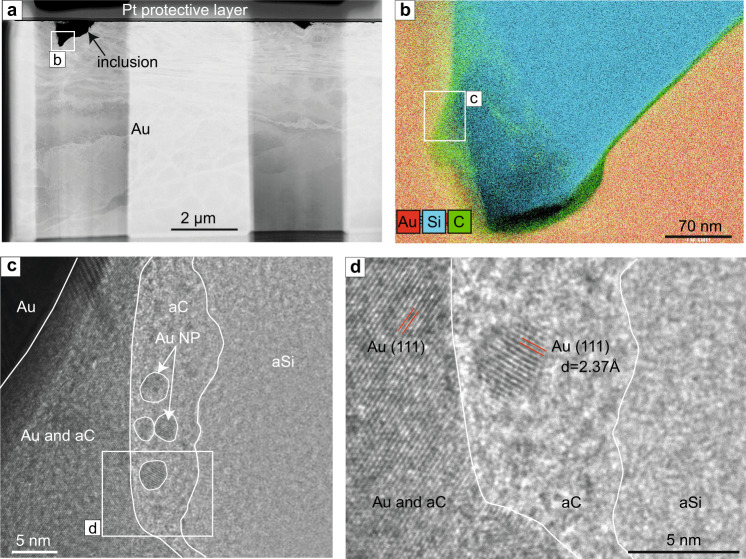
Fig. 3. Beta Hunt nanoparticles in amorphous carbon and silica.
a High-Annular Dark Field Scanning Transmission Electron Microscopy (HAADF-STEM) image of the entire Beta Hunt foil showing a large inclusion on the left-hand side and a smaller inclusion on the right-hand side of the foil. b Energy-dispersive X-ray spectroscopy (EDS) elemental map of the part of the largest inclusion (indicated by a white rectangle in Fig. 3a) showing amorphous silica in the centre of the inclusion and a thin carbon layer at the interface with gold. c Transmission Electron Microscopy (TEM) image of the area within the white rectangle in Fig. 3b. The image shows amorphous silica (aSi) in the right-side of the image, amorphous carbon (aC) concentrated along the interface between the amorphous silica and the host gold, numerous rounded Au or Ag NPs (Au NP) are encapsulated in the amorphous carbon phase. d High Resolution TEM image of the area indicated by a white rectangle in Fig. 3c. showing 5 nm Au (or Ag) NP in amorphous carbon. A d-spacing of 2.37 Å was obtained for the metal NP using FFT analysis and was matched with Au, Ag, or Au-Ag alloy crystal structures.

