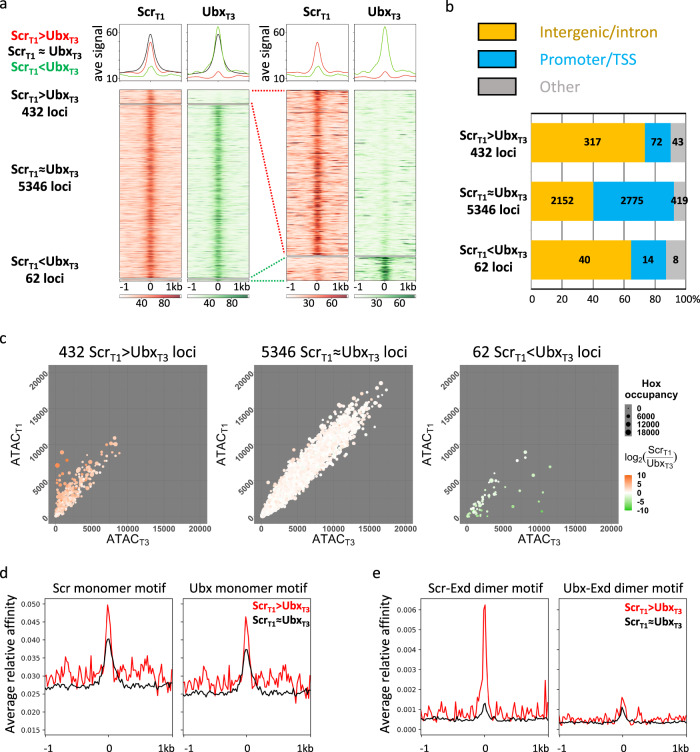
Fig. 2. Genome-wide comparison between ScrT1 and UbxT3 DNA-binding profiles.
a Left: heatmaps and histograms of ScrT1 > UbxT3, ScrT1 ≈ UbxT3 and ScrT1 < UbxT3 loci plotted for ScrT1 and UbxT3 ChIPs signals. Right: blow-up of the 432 ScrT1 > UbxT3 and 62 ScrT1 < UbxT3 loci. Loci in each of the three classes are sorted by the FDR values generated by DiffBind in ascending order (see “Methods” for details). The loci are aligned at the peak center, with +/−1 kb shown. In all heatmaps in this and other panels, the color intensity scores are arbitrary values indicating relative TF occupancy at the target locus. b Bar graph showing the genome region classification of ScrT1 > UbxT3, ScrT1 ≈ UbxT3 and ScrT1 < UbxT3 loci. c Scatter plots comparing T1 and T3 chromatin accessibility in ScrT1 > UbxT3 (left), ScrT1 ≈ UbxT3 (middle) and ScrT1 < UbxT3 (right) loci. The size of a dot represents the average of ScrT1 and UbxT3 ChIP signals at that locus, and the color indicates the log2 ratio between ScrT1 and UbxT3 ChIP-seq signals. d, e Histograms showing relative affinity scores using NRLB models for Scr and Ubx monomers (d), and Scr-Exd and Ubx-Exd heterodimers (e) in ScrT1 > UbxT3 (red) and ScrT1 ≈ UbxT3 (black) loci +/−1 kb relative to the peak center.

