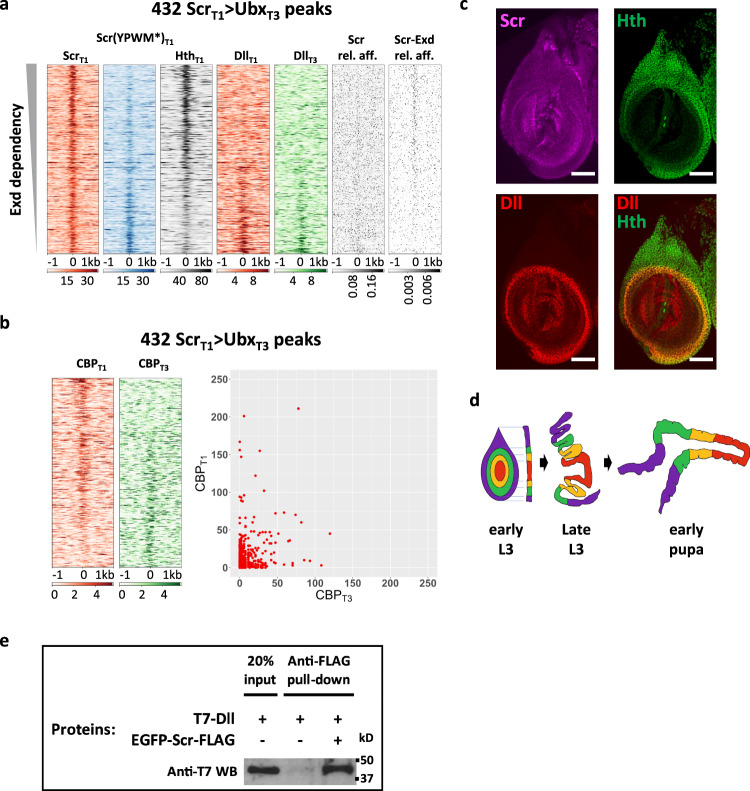
Fig. 5. Exd-dependent and -independent ScrT1 > UbxT3 peaks.
a Heatmaps of the 432 ScrT1 > UbxT3 ChIP-seq peaks sorted by Exd-dependency, based on the relative intensities of the ScrT1 and Scr(YPWM*)T1 ChIP-seq signals. Also shown are the ChIP-seq signal for Hth in T1 leg disc and the ChIP-seq signals for Dll in T1 and T3 leg discs. The relative affinities of Scr monomer (Scr) and Scr-Exd dimers using the respective NRLB models are also plotted. b Heatmaps (left) and scatter plot (right) showing CBP occupancy at the 432 ScrT1 > UbxT3 peaks in T1 and T3 leg discs. The peaks in the heatmaps are sorted according to the ratio of T1:T3 CBP occupancy. c The expression patterns of Scr (magenta), Hth (green), and Dll (red) in T1 leg imaginal discs. Scale bar: 50 μm. d Schematic showing the morphological changes of leg discs during metamorphosis. Both top view and lateral cross-section views are shown for the early L3 stage, and the lateral cross-section view is shown for late L3 (wandering stage) and early pupal stages. e Co-immunoprecipitation showing the physical interaction between Scr and Dll. Immunoprecipitation was performed using anti-FLAG antibody and western blot was probed with anti-T7 antibody. This experiment was repeated three times, and one representative result is shown. Source data are provided as a Source Data file.

