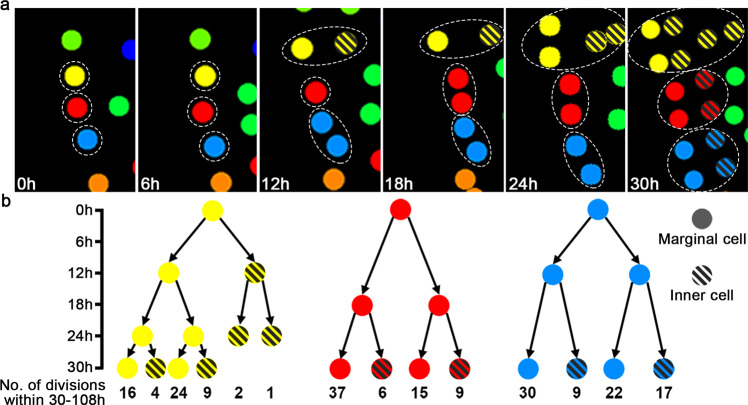
Fig. 6. The impact of lineage and position on division activities of meristem progenitor cells.
a Cell division and lineage progression of three meristem progenitor cells from 0 h to 30 h. The images are part of Fig. 3a–f (0–30 h), highlighting the three cell lineages that contribute to the majority of cells in the meristem with the dashed lines, and labelling marginal cells with solid circles and inner cells with the circles filled with diagonal stripes. The complete lineage progression of the three meristem progenitor cells and their descendants (the yellow, red and blue sectors) is shown in Fig. 3a–s. b Relationships among cell lineages, cell position and quantified division events. Each circle of one family tree represents one cell at the indicated time point from 0–30 h. Two black arrows from one cell represent one round of cell division and illustrate the relationship between the cell and its two immediate progenies. Y-axis: the time-lapse from 0 h to 30 h. X-axis: the total number of cell division events for each cell (at 30 h) and its progenies during the following 30–108 h time frame (the quantified division events with the cell IDs shown in Supplementary Data 3, and cell position with IDs shown in Supplementary Fig. 19). b labels the clonally related cells with the same color in each family tree (as yellow, red and blue shown in (a) and highlights the positional information of each cell (as solid circles and circles filled with diagonal stripes shown in (a). During the 30–108 h time frame, cells from the same progenitor cell display variable division activities, and cells located at the marginal layer (solid circles) of the meristem show more division events than the cells located at the inner (or submarginal) layer (circles filled with diagonal stripes). All the meristem progenitor cells in the three independent gametophyte samples were analyzed (in Fig. 6; Supplementary Figs. 11 and 12), showing similar results.

