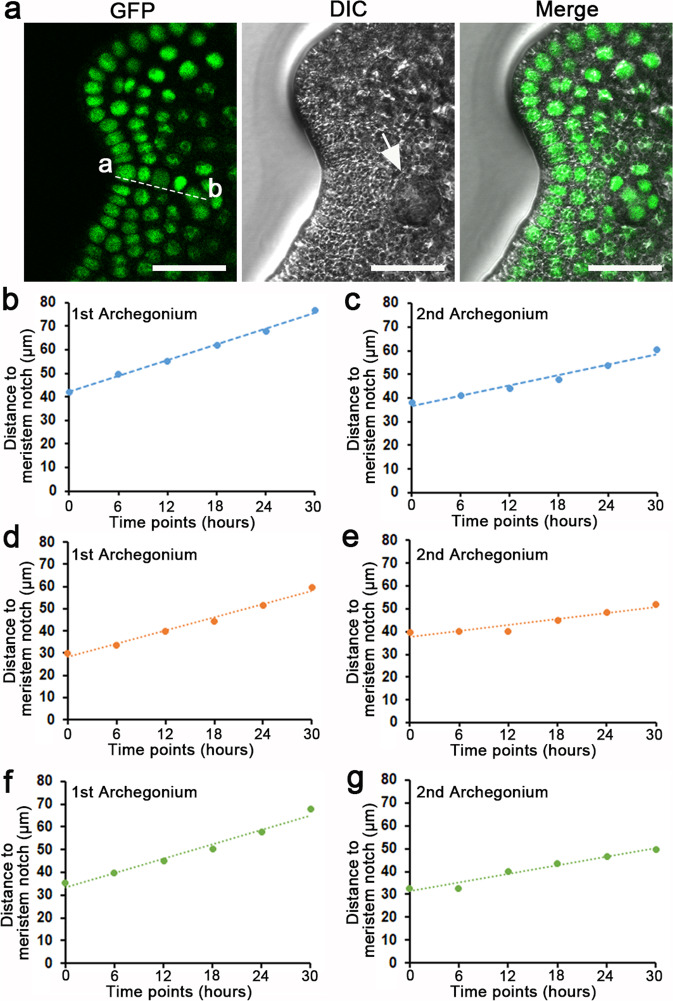
Fig. 7. The dynamic distance between archegonia and the meristem notch during gametophyte development.
a The calculation of distance between a meristem notch (or the location where the meristem notch will be formed) (point a) and the center of an archegonium (point b) in one representative image. The image in (a) is the part of one optical section of the sample shown in Fig. 2m. Scale bar: 50 μm. b–g Dynamic distances between archegonia and meristem notches. Y axis: Distance between a meristem notch and an archegonium. X axis: six consecutive time points starting from initiation (shown as 0 h in the graphs) of the archegonium. The distance in b and c was calculated based on the confocal images of the gametophyte shown in Fig. 2, and the first and second archegonia started to initiate at 54 h and 84 h, respectively. The distance in d and e was calculated based on the confocal images of the gametophyte shown in Supplementary Fig. 4, and the first and second archegonia started to initiate at 54 h and 90 h, respectively. The distance in f and g was calculated based on the confocal images of the gametophyte shown in Supplementary Fig. 5, and the first and second archegonia started to initiate at 60 h and 84 h, respectively. The source data for (b–g) are included in Supplementary Data 4.

