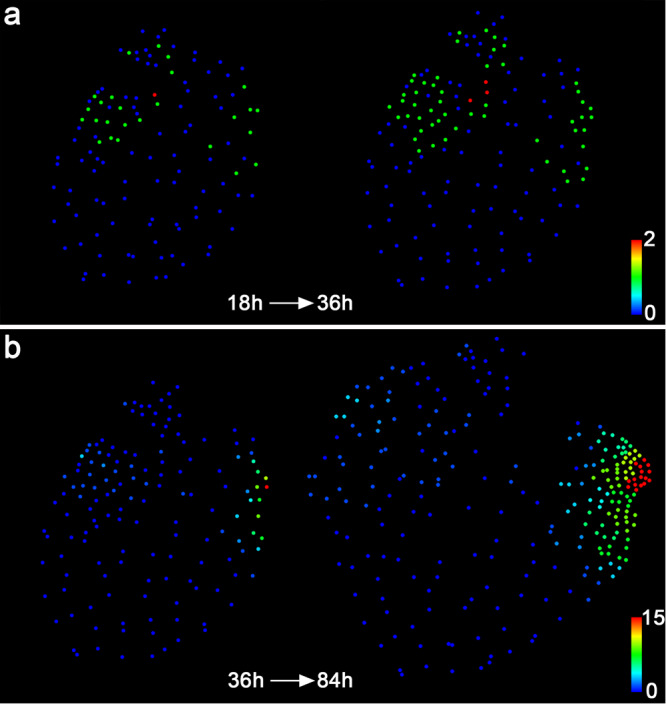
Fig. 9. Quantification of cell division events in the ablated Ceratopteris gametophyte.

Each dot represents the location of the segmented individual nucleus shown in Fig. 8. Quantification of cell division events in the following time frames from 18–36 h (a) and 36–84 h (b). The quantified cell division events are shown in the images from the first (left panel) and last (right panel) time points of the indicated intervals. Colors indicate the number of cell division events in each cell lineage during the indicated time intervals, with the scale from blue (0) to red (2) (a) and from blue (0) to red (15) (b).
