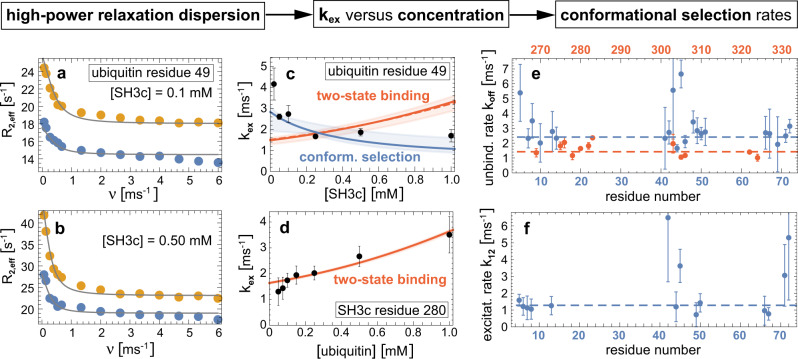
Fig. 2. From relaxation dispersion NMR data to binding mechanisms.
a, b Effective transverse relaxation rate R2,eff versus nutation frequency ν of the applied transverse field measured by 15N relaxation dispersion for the amide of the ubiquitin residue 49 in the presence of 0.1 mM and 0.5 mM of SH3c. The blue and yellow data points result from measurements at the two 15N resonance frequencies 60.795 MHz and 96.313 MHz. The gray lines represent fits in the fast-exchange regime to determine the exchange rate kex (“Methods”). c The obtained exchange rates kex of the ubiquitin residue 49 (black data points) decrease with increasing SH3c concentration, which indicates conformational selection. The blue and red lines with shaded error regions result from fits of the kex equations of the two-state and conformational-selection binding mechanism (Fig. 1, Supplementary Methods). d For the amide of the SH3c residue 280, the exchange rate kex increases with the ubiquitin concentration and can be well fitted with the kex equation of two-state binding. e Unbinding rates koff obtained from fits with the conformational-selection model for ubiquitin residues (blue data points) and from fits with the two-state binding model for SH3c residues (red data points, Supplementary Figs. 3 and 4). f Conformational excitation rate k12 from conformational-selection fits of ubiquitin residues (Supplementary Fig. 3). Global and residue-specific uncertainties in the R2,eff values were estimated as described in Methods. The larger one of these two uncertainty estimates for each data is reported (smaller than the plot markers). The error bars in (c–f) represent standard errors of data fits (“Methods” and Supplementary Methods). Source data are provided as a Source Data file.

